Categories
Blog Data Visualization

Power BI vs. Excel: Which is Better for Data Visualization?

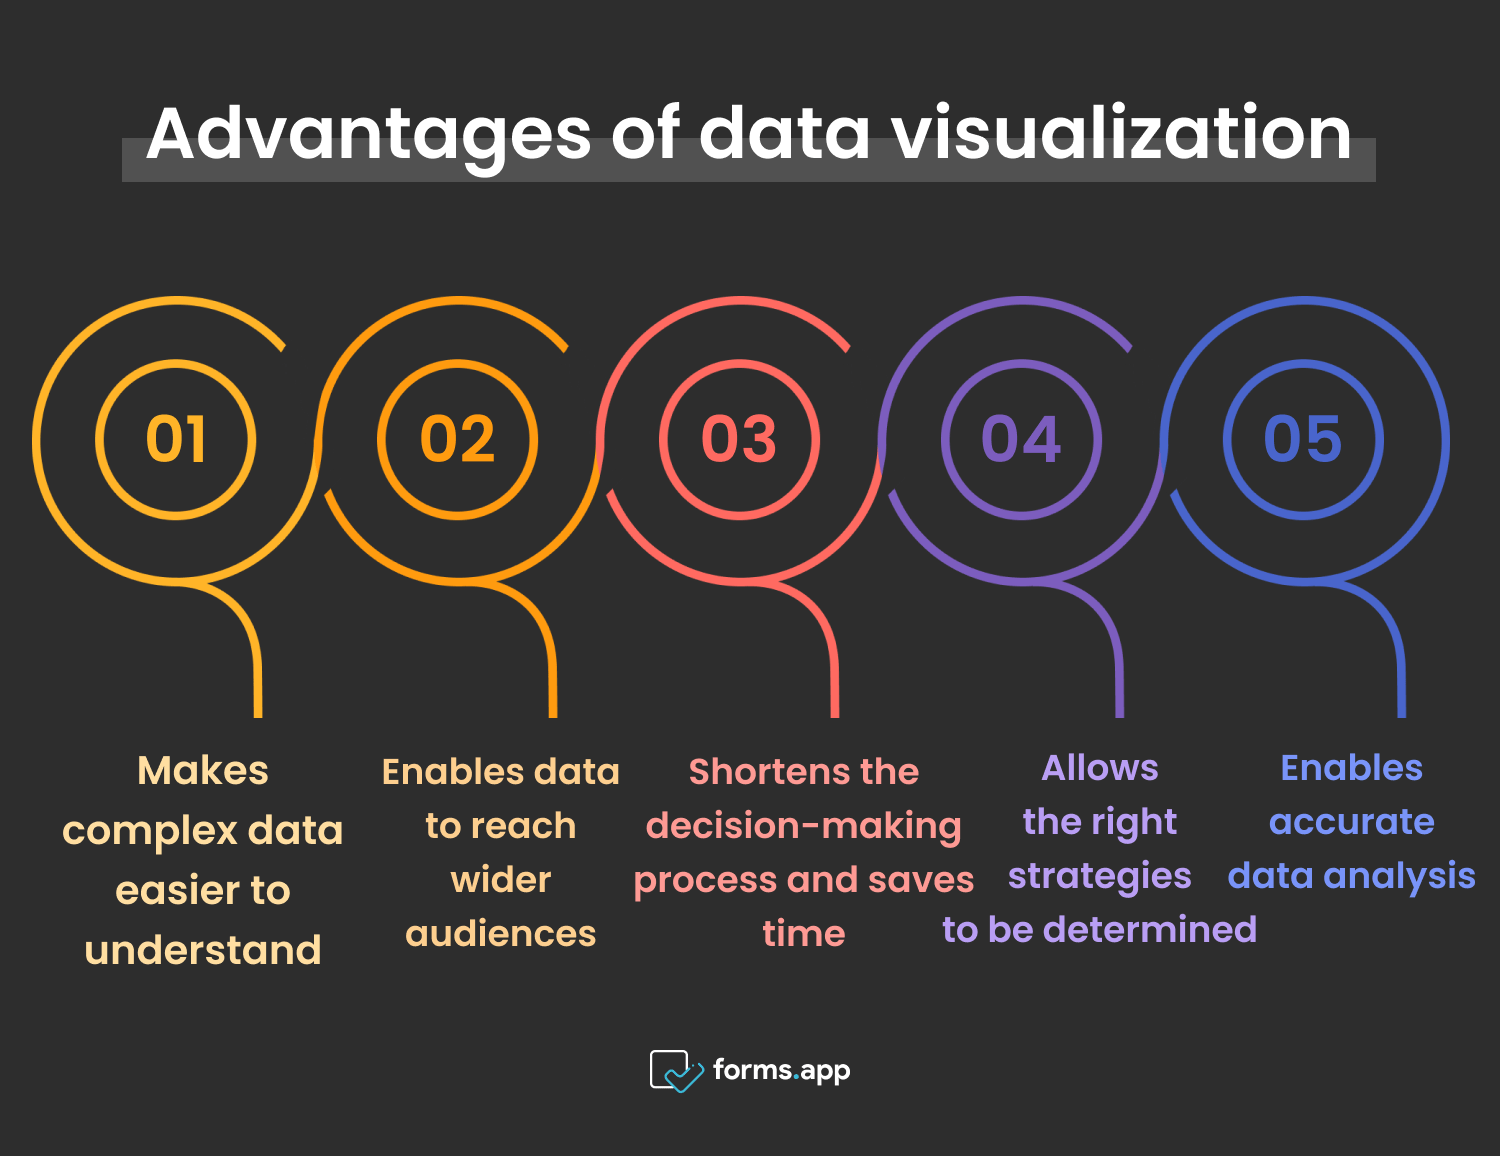
Are you leaving money on the table? In today’s data-driven world, you will fall behind if you don’t leverage advanced data analytics.

You might miss crucial insights and make decisions based on your gut feelings instead of the facts.  These decisions taken based on guts might drop your productivity gains.

Feel like you’re not getting the most out of your data? Trust me, I get you. 

As a Data Analyst, I’ve been in trenches, fighting with the same question: “Which are the best data visualization tools?”

However, Power BI and Excel are two of the best tools available.

The decision to work with one of these two can feel overwhelming. This decision can either make or break your ability to turn raw data into actionable insights.

In this blog, I’ll do the necessary groundwork to help you choose the best by comparing Power BI vs Excel.

Power BI vs Excel: Table of Contents

  • Overview of Power BI
  • Overview of Excel
  • Differences Between Excel vs Power BI
  • Benefits of Power BI Over Excel: How it Holds the Upper Hand?
  • Benefits of Excel vs Power BI: How it Holds the Upper Hand?
  • Why use Power BI: 3 Deciding Points to Know
  • Why use Excel: 3 Deciding Points to Know
  • Power BI vs Excel: Who Wins the Race?
  • Frequently Asked Questions

Overview of Microsoft Power BI

Microsoft Power BI is one of the popular business intelligence and big data visualization techniques and tools that transform raw data into interactive dashboards.

It helps you get enterprise-level insights for informed decision-making.

Core Functionalities of Power BI

1. Visualization

You can create intuitive reports using the drag-and-drop option offered by Power BI. Moreover Power BI also allows you to build visuals using a variety of customizable visuals.

2. Data Integration

Power BI allows you to connect with diverse sources like databases, cloud services and Excel files.

3. Collaboration and Sharing

Using Power BI, you can share insights across organizations using web and mobile apps to enable data exploration.

4. Intelligent Analytics

For efficient data analysis, you should use embedded AI features like Natural Language query, anomaly detection, and automated insights.

Overview of Excel

Microsoft Excel is a widely used spreadsheet application in the Microsoft Office suite. It helps you organize, analyze and store data.

It helps you present the data in a tabular format and is suitable for various tasks, from basic data entry to complex statistical analysis.

Core Functionalities of Excel

1. Data Management

One of Excel’s best features is “Data Management,” which allows you to organize and store data within spreadsheets using rows and columns.

2. Calculations

You can also use the built-in formulas to perform various calculations, derive insights, and automate repetitive tasks.

3. Visualizations

Using Excel, you can create charts and graphs to visually represent data and communicate the findings effectively.

4. Customization

Lastly, Excel’s pre-built templates can be used for common tasks and VBAs to develop custom solutions.

Next, let us understand the difference between Excel and Power BI.

Difference Between Excel and Power BI

Feature

Power BI

Excel

Data Handling/Capacity

Handles millions of rows efficiently. Connects directly to data warehouses and cloud sources

Limited to approximately 1 million rows. Struggles with performance on larger datasets

Data Visualization

It is designed for dynamic and interactive visualizations

Primary statistics charts and graphs in Excel present data

Data Sources

Can combine data from multiple sources, including the cloud platforms

Limited in the number of data sources it can merge with

Customization & Flexibility

It is less flexible and offers some pre-defined report templates

It offers a high level of flexibility and customization and complete control over formatting, styling and graphical elements

Ease of Use

Power BI has a more intuitive interface for data visualization but needs training for advanced features

Excel is simple and easy to use, especially for simple tasks

Processing Speed

Power BI offers faster processing than Excel

Excel offers slower processing than Power BI


Let’s talk about the benefits of Power BI over Excel.

Benefits of Power BI Over Excel: How it Holds the Upper Hand?

Power BI offers many benefits, but the below benefits hold the upper hand against Excel.

1. Handles Large Datasets

You can manage and analyze massive amounts of data, even with millions of rows. Power BI uses a compression algorithm to import cache data to help you analyze large datasets.

2. Real-Time Data Insights

Power BI can connect with vast data sources to provide up-to-the-minute analytics and dashboards. Moreover, it can automatically refresh reports and visualizations when new data comes in to serve you with the latest insights.

3. Interactive Visualizations

One of the vivid features of Power BI is its dynamic, interactive and linked visualizations. You can filter, sort and navigate between visuals to identify data from different angles to gain deeper understanding.

4. Collaboration

Lastly, Power BI provides superior collaboration features compared to Excel, thus allowing you to share dashboards and reports. Its cloud-based services enable collaborative data analysis across organizations.

This was about the benefits of Power BI over Excel, but do you know how conventional data visualization tools like Excel ace over Power BI?


In the below section, I’ll talk about the benefits of Excel over Power BI.

Benefits of Excel Over Power BI: How it Holds the Upper Hand?

Excel offers many benefits, but the below benefits of Power BI hold the upper hand against Power BI.

1. Flexibility and Customization

Excel offers great flexibility and customization. You can completely control formatting, styling and data arrangement, allowing you to design Excel spreadsheets for specific needs and use cases.

2. Familiarity

Excel is a more common and familiar tool for many users thus making it a handy tool. Its simplicity and familiarity make it easy to work with data in spreadsheets.

3. Ease of Use for Smaller Datasets

Out of all data visualization tools, Excel is more intuitive for simple tasks and is well-suited for ad-hoc analysis. Moreover, Excel can enable data manipulation and analysis on a smaller scale.

4. More Operations with Data

Lastly, Excel offers more operations with data than Power BI. Simply put, it has more diverse functionality and is the go-to choice for expert data analysis.

While discussing the difference between Excel and Power BI, I would also like to highlight why you should use Power BI instead of Excel.

Why Use Power BI Over Excel: 3 Deciding Points to Know

Microsoft Power BI is a data analytics and reporting tool that helps you visualize raw data and present actionable information.

Below are the five reasons to use Power BI over Excel:

1. High-Level Analytics

Power BI excels at offering comprehensive business analytics, making it easier to identify trends and insights in data.

It is more feasible for enterprise-level data to offer responsive visualization and modeling.

2. Real-Time Data Analytics

Being a modern-day data visualization tool, Power BI can connect live data sources to offer up-to-the-minute information and insights.

3. AI Integration

Power BI brings together AI and Business intelligence through its Quick Insights Tools. With this powerful blend analysis, you can gain better insights into your data.

Now that we’ve discussed why you should use Power BI instead of Excel let me explain why you should use Excel instead of Power BI.

Why Use Excel Over Power BI: 3 Deciding Points to Know

1. Cost and Accessibility

Excel is part of the MS Office Suite, which makes it more readily accessible and cost-effective for users.

2. Ad-hoc Analysis and Calculations

Excel is beneficial for ad hoc analysis and calculations. It can also organize data, transform it and perform mathematical operations.

3. Smaller Datasets

As a data visualization tool, Excel is more effective for manipulating and formatting smaller datasets. Its workbook can load up to 1 million rows and 16,000 columns per worksheet.

Power BI vs Excel: Who Wins the Race?

When we talk about Data visualization, both these data visualization tools are useful in different areas.

Power BI is the best choice for large companies working with large amounts of data and creating interactive charts.


I recommend Excel if you’re dealing with a small amount of data and need to make frequent changes.


Choosing the best between Power BI and Excel depends on your needs. Knowing what each one does best can help you use the data effectively.

Frequently Asked Questions

1. What’s the main difference between Power BI and Excel for handling data?

Power BI is better at handling large amounts of data (up to 1 million rows). However, if you have limited data, I recommend using Excel.

2. Which is better for making charts: Power BI or Excel?

Power BI is great if you want to experiment with different types of charts for your data and visualize it in real-time. However, Excel is a good option if you want simple but visually appealing charts.

3. When should I use Excel instead of Power BI?

Excel is a good choice when you need to make changes easily, work with smaller amounts of data, or perform quick calculations. It is also cost-effective, especially if you already use Microsoft Office.

Categories
Blog Data Visualization

Power BI vs. Looker: Choosing the Right BI Tool for Your Needs

Business Intelligence and data visualization are key in visualizing data.

That is why you need to know which tools you’re working with!

For instance, Looker Studio and Power BI are two important business intelligence tools.

Microsoft develops the reporting and analytics features provided by Power BI, while Google Cloud develops Looker Studio, a BI tool.

In this article, I’ll discuss the differences between Power BI and Looker to help you select the best tool.

Let’s get started!

Power BI vs Looker: Table of Contents

  • Business Intelligence Tools: What are they?
  • Overview of Power BI
  • Overview of Looker
  • What Are the Differences Between Power BI vs Looker
  • Power BI vs Looker: Pricing Comparison to Consider
  • When to Choose Power BI and Looker?
  • Choose the Best Tool That Fits Your Needs!
  • Power BI vs Looker: Frequently Asked Questions

Business Intelligence Tools: What are they?

Before discussing Power BI vs Looker, let’s quickly understand the role of business intelligence in modern business.

Business intelligence tools are designed to gather, analyze, and visualize data from various sources.

Implementing data visualization best practices to make informed decisions becomes easy when you have the right tools.

These tools allow businesses to transform raw data into actionable insights, which can help them gain a competitive edge.

Although various Business intelligence tools are available, the comparison of Power BI vs Looker is crashing the records.

First, let’s talk about Power BI.

Overview of Power BI

Power BI, which Microsoft developed, is a popular self-service BI tool.

The tool offers a broad range of features for data analysis and visualization. 

Its strong integration with Microsoft products and services makes it a compelling choice for organizations that use the Microsoft ecosystem.

Designed for power users and businesses that require deep data insights, Power BI can integrate with Microsoft products such as Excel, Azure and Teams.

Key Features of Power BI

Data visualization tools comparison would always be incomplete without comparing the features of BI tools.

Below are some features that make Power BI one of the best data visualization tools.

  • Tools like Power Query and DAX enable in-depth data transformation and calculation.
  • Can connect with 100 data sources, including cloud services, on-premises databases and third-party platforms.
  • Microsoft AppSource allows you to create unique visuals in addition to the many built-in visuals.
  • Security and scalable reporting for big businesses.

Further, let’s understand the Pros and Cons of Power BI.

Pros and Cons of Power BI

As with any BI tool, Power BI has strong and weak points. Below are the Pros and Cons of Power BI  that you should consider:

Pros of Using Power BI

  • Power BI’s integration with Microsoft products makes it a natural choice for organizations that use the Microsoft ecosystem.
  • Moreover, it offers a wide range of visualizations, thus allowing users to create compelling reports and dashboards.
  • Its AI power enables users to uncover the data’s hidden patterns, trends and outliers.

Cons of Using Power BI

  • Power BI’s data modeling capability can be complex for users unfamiliar with the Microsoft ecosystem.
  • Power BI allows sharing and collaboration, yet its area is less efficient than other tools.
  • Lastly, its licensing option and cost can differ based on the features and level of access needed.

Further, let’s talk about Looker Studio.

Overview of Looker

Looker Studio is a leading cloud based business intelligence software that offers a wide range of analytics and data exploration capabilities.

The tool is well-known for its user-friendly interface and powerful data modeling ability.

Designed for simplicity and real-time analytics, Looker Studio can seamlessly integrate with Google tool suites like Google Ads and BigQuery.

Below are some features that make Looker Studio one of the best cloud based business intelligence software.

Key Features of Looker

While doing a Data visualization tools comparison, the features offered by each of them play an important role. 

Let’s check out the features offered by Looker.

  • Intuitive for beginners and is non-technical for users.
  • Can easily connect with Google tools and third-party data sources via connectors.
  • Allows multiple users to edit and share reports in real-time.
  • Looker is free for individuals and small teams, thus making it highly accessible.

Further, let’s understand the Pros and Cons of Looker.

Pros and Cons of Looker

Similar to any BI tool, Looker has its strengths and limitations. Below are the pros and cons of Looker to consider:

Pros of Using Looker

  • Looker’s intuitive feature can make data analysis easy without needing technical skills.
  • The data modeling ability of Looker enables complex data transformation and ensures data consistency.
  • Users can seamlessly collaborate on dashboards and reports, share insights and schedule automated data delivery.

Cons of Using Looker

  • Despite being user-friendly, you might need to spend some time mastering all the features of Looker.
  • Although Looker’s data visualization ability is adequate for many use cases, it might not offer the same ease of use as other tools like Power BI.
  • It is more expensive, particularly for small businesses or organizations with limited budgets.

Let’s check out the differences between Power BI and Looker.

Differences Between Power BI vs Looker

Point of Comparison

Power BI

Looker

Data Visualization

Focuses on customized data visualization with detailed analytics

Focuses on simple and easy-to-use visualizations

Data Integration

Can easily integrate with other Microsoft products and services

Its data modeling feature lets you integrate data from multiple sources

Customization

Extensive customization options for visualization that allow you to build tailored reports and dashboards

Allows customization at data modeling levels, enabling you to apply business logic

Security

Multiple repositories that allow you to store and manage data

Its AES 256-bit encryption enables efficient data security

Furthermore, let’s analyze the pricing differences in detail when comparing data visualization tools.

Power BI vs Looker: Pricing Comparison to Consider

Power BI Pricing

Although the free version of Power BI offers data connectivity for simple datasets, users must buy a paid subscription to use the advanced features.

Power BI offers paid subscriptions starting around $10 per user/month for the Pro license.

Looker Pricing

The basic version of Looker Studio is completely free and can be easily accessed by small businesses.

Looker also has a pro version, which offers team workspaces and enterprise-level customer support via Google Cloud Customer Care.

Additionally, there is a fee if you use third-party data connectors to import data into Looker Studio.

Further, let’s check out the use cases of Power BI and Looker.

When to Choose Power BI and Looker?

Opting between Looker Studio and Power BI depends on your organization’s needs, budgets and technical know-how.

These tools are excellent but shine in different cases and situations.

Check out the below section to know when to use Looker vs when to use Power BI.

Looker is Best For:

  • You’re running a small or medium business that needs an affordable, user-friendly tool to create visually appealing reports.
  • You need real-time data visualization for marketing and website analytics with minimal technical skills.
  • You need a tool that allows multiple users to edit and share easily.

Power BI is Best For:

  • You’re a large organization or enterprise with complex reporting requirements.
  • Scalability and enterprise-grade features are important for handling large volumes of data.
  • You need a dedicated data team or technical experts who can fully use Power BI’s advanced features.

Choose the Best Tool That Fits Your Needs!

Both Power BI and Looker are highly recommended data visualization tools.

Implementing a successful data visualization process can be daunting. However, selecting the best one depends on particular use cases and requirements.

Looker is popular for its efficient modeling capability to handle large datasets.

Power BI provides a user-friendly interface and seamless integration with other Microsoft products.

Frequently Asked Questions

1. Is Looker as good as Tableau?

Looker is often compared with Tableau. While Tableau may have a more intuitive interface and larger user base, Looker stands out for its efficient data modeling ability to create custom reports designed to specific business needs.

2. What are some other tools similar to Power BI?

As a Data Migration Consultant who likes Looker, I also know the value of a good deal! In addition to Tableau and Qilk Sense, consider these budget-friendly Power BI alternatives: Zoho Analytics is easy to use and priced well, and Metabase is a free, open-source option. These offer solid features without breaking the bank!

3. What should I consider when choosing between Power BI and alternatives?

When choosing a BI tool, consider the following:


  • Data Sources: Can it connect to your existing data?
  • Ease of Use: Is it user-friendly for your team’s skill level?
  • Visualization: Does it offer the charts and graphs you need?
  • Pricing: Does it fit your budget?
  • Support & Training: Is there good documentation and support available?
Categories
Blog Data Visualization

7 Easy Steps to Create Dashboards in Power BI

Overview

This quick Power BI dashboard tutorial outlines the essential workflow for building dashboards in Power BI:

  • Step 1: Connect to your data source (like Excel).
  • Step 2: Build a data model with table relationships.
  • Step 3: Create a report using data visualization tools (charts, graphs).
  • Step 4: Pin those visuals to a new dashboard.
  • Step 5: Enhance and customize the layout and theme.
  • Step 6: Share the dashboard with your team.
  • Step 7: Maintain and improve with refreshes and interactivity.

In this blog, I will break down all 7 steps in detail to help you build your first Power BI dashboard.

If you’ve been sitting in front of the Power BI interface while wondering how to get started, you’re not alone!

Power BI is one of the most powerful data visualization tools out there. And interactive dashboards are one of its core strengths.

But to build dashboards in Power BI? You will have to go through a steep learning curve! It’s slightly tricky to get started, but once you’ve got the hang of it, you will become an expert in no time!

However, the first step is always the hardest, and that’s exactly what I’m here to help you with in this step-by-step Power BI dashboard tutorial.

I will break down each and every step into a clear action you can take, and guide you through the process of making your first dashboard.

Let’s get started!

Create  Dashboard in Power BI: Table of Contents

  • How to Create Dashboards in Power BI: Step-by-Step Guide
  • Augmented Tech Labs: Helping You Build Power BI Dashboards
  • Create Dashboard in Power BI: FAQs

How to Create Dashboards in Power BI: Step-by-Step Guide

Before we get started with the tutorial, there are 2 prerequisites you will need to follow along:

  • First, a Power BI Desktop Account (I’ve used the free version to create this tutorial). 
  • Second, a sample file, like an Excel sheet with at least a few rows and columns. 

Once you’ve got these ready, follow this simple Power BI Dashboard tutorial:

Step 1: Connect to Your Data Source

The first step in building dashboards in Power BI is to connect your data with the tool. To do this:

  1. Open Power BI Desktop.
  2. On the “Home” page, click on “Get Data” and choose the source of your data. For this tutorial, I recommend starting with Excel.
  3. Browse to and select your Excel file.
  4. The “Navigator” window will appear and tell you which sheets and tables are available in your workbook.
  5. Select the table(s) you want to use and click “Load” to import them directly.
  6. Alternatively, you can also click on “Transform Data” to clean and shape your data first.

Pro Tip: Using Transform Data opens the Power Query Editor, one of the most powerful data visualization tools for cleaning messy data before it even enters your model.

Step 2: Build Your Data Model (Table Relationships)

If you loaded multiple tables, you need to define how they connect. This is what we call “data modelling.”

And a proper data model is the engine behind effective Power BI Dashboards. Without it, Power BI will not be able to understand how different data points are connected internally.

Here’s how you can build your data model:

  1. On the left-hand pane, click the “Model” view (it should be the third icon from the left).
  2. Power BI may auto-detect and create relationships (this will appear as a line between tables).
  3. If Power BI does not auto-detect and create relationships, don’t worry. You can create one manually by clicking and dragging a field (e.g., CustomerID) from one table to the related field in another table.

Remember, properly defining relationships in this step is crucial. It will ensure that your filters and visuals work correctly across different tables.

Step 3: Create Your Report with Data Visualization Tools

This is the step towards which we have been building up, the step where you bring your data to life.


Here’s how you can build your dashboards in Power BI via the report visuals option:

  1. Go to the Report view (the first icon on the left pane).
  2. On the right, you should see the Fields pane (i.e., your data tables) and the Visualizations pane (i.e., charts and formatting options).
  3. To create a visual: Select a chart type from the Visualizations pane (e.g., a Stacked Bar Chart). Then, drag fields from the Fields pane and drop them into the Axis, Legend, and Values buckets well.
    For example, if you want to see “Sales by Region”, drag Region to Axis and Sales to Values.
  4. If you want to add more visuals to your dashboard, just repeat this process. Add different visuals like line charts, maps, or KPIs to your report canvas to tell a complete story. 

The report page that you have created in this step will become the source for your dashboard.

Step 4: Create Your Power BI Dashboard

As soon as you’re done with Step 3, you have created the basis for your Power BI dashboard. 

The next step in the process of building Power BI Dashboards is to bring your report to life.

  1. Save your .pbix file and then click Publish on the Home page. This is where you are publishing your report to the Power BI Online Service.
  2. Once published, your browser will open to the Power BI service. Open the published report.
  3. Once you are viewing the report, hover over any visual. Next, click the Pin icon (it’ll look like a pushpin) that appears.
  4. A dialog box will ask you to pin this visual to a new or existing dashboard. Select New dashboard, give it a name (e.g., “Sales Overview“), and click Pin.
  5. Repeat this process, pinning other key visuals from your report(s) to the same dashboard. 

You are now effectively creating a dashboard in Power BI by adding the most important metrics of your report onto a single canvas.

Step 5: Enhance and Customize Your Dashboard

Till now, we have created a canvas with several “pinned tiles”.


But a great dashboard is more than just pinned tiles! It uses the full power of data visualization tools to create a source for effective decision-making!

 Let me show you how to customize your Power BI dashboards: 

  1. On your dashboard, click Edit.
  2. Add Text Boxes or Images: You can use the “+ Add a tile” button to include labels, commentary, or company logos. This will give context to viewers or enhance the appeal of your dashboard.
  3. Resize and Arrange: You can also click and drag the corners of visuals to resize them. I highly recommend dragging tiles to arrange them in a logical, easy-to-follow layout.
  4. Apply a Theme: One of the best things about building dashboards in Power BI is that you can apply consistent color schemes throughout your visual for a professional look. To do this, click on Dashboard theme and select a color scheme that suits you.

Step 6: Share and Collaborate

This is the final step of this Power BI dashboard tutorial: sharing your work with colleagues and stakeholders. 

This is another strength that makes Power BI one of the best data visualization tools – it offers several robust collaboration options, such as:

1. Direct Sharing:

  • From your dashboard in the Power BI service, click the Share button (look for this at the top right of the screen).
  • Enter the email IDs of your colleagues or stakeholders. You can also add a message and configure whether recipients can reshare the dashboard or just view it.
  • Click Share, and they will receive an email notification with a direct link to the dashboard.

2. Publish to Web (Use with Caution!):

  • For broader, public sharing, select File > Embed report > Publish to web (public).

Remember, when you click on “Publish to Web,” it will create a link that anyone on the internet can see, even if they don’t have a Power BI license! So, I suggest using this only for non-sensitive data intended for a public audience!

3. Workspace Apps (For Enterprise Teams):

  • If your dashboard is saved within a workspace, you can publish it as an App.
  • To do this, navigate to your workspace and click on Create app.
  • You can then configure the audience, specific pages to include, and a custom theme before publishing the app for your entire organization or a specific group.

4. Microsoft Teams Integration:

  • Lastly, you can directly tab and share your dashboard or report within a Microsoft Teams channel for seamless collaboration.

Once you have shared your Power BI report with the relevant stakeholders, they can view the dashboard and interact with filters. Plus, if you have granted them permission to do so, they will also be able to see the underlying reports that you have used to make the dashboard. 

This will turn your Power BI Dashboard into a central hub for data-driven decision-making!

Step 7: Enhance Interactivity and Maintain Your Dashboard

Once you have published and shared your Power BI dashboard, it is technically live. However, the process of building dashboards in Power BI is often iterative. 

And one way to enhance your dashboard’s appeal over time is to increase its interactivity.

Here’s how you can do this:

  • Use Slicers and Filters: You can add timeline slicers, dropdown menus, or checkbox filters to allow viewers to explore the data on their own terms. It will add dynamism to your data.
  • Configure Drillthrough: Drillthrough pages are detailed pages that focus on a specific tem, for example, a region within the chart. Once you have set up a drillthrough, users can right-click on a data point and “drill through” to a detailed page focused on that item!
  • Leverage Tooltips: One of the best things about Power BI dashboards is that you can create rich, custom tooltips that appear when hovering over visuals. These will provide viewers with additional context and metrics while keeping the main view clean and concise.
  • Schedule Data Refresh: To ensure your dashboard remains accurate, I highly recommend configuring a scheduled refresh for your dataset in the Power BI Service. To do this: 
  1. Go to your Workspace.
  2. Navigate to the Datasets tab and select your dataset.
  3. Go to Settings and configure the refresh schedule under the Data Source Credentials and Scheduled Refresh sections.

And that’s it! You’ve successfully created and iterated your first Power BI dashboard!

Also Read: 10 Data Visualization Best Practices – How to Convert Data into Insights

Augmented Tech Labs: Helping You Build Power BI Dashboards

Through this complete, step-by-step tutorial, we have discussed the A to Z of how to create a Power BI dashboard from scratch. I have also outlined how you can deploy them as a powerful, interactive tool for your entire organization.

Now, it’s time for you to slowly and steadily start building your first dashboard using Power BI.

And if you get stuck at any step in the process, you can reach out to us at Augmented Tech Labs! We have been using data visualization tools like Power BI for over a decade to help solopreneurs, enterprises, and SMBs create interactive dashboards for their operations. 

So, connect with us, and will help you troubleshoot and solve any and all errors that you might face in creating Power BI dashboards!

Create Dashboard in Power BI: FAQs

1. What is the difference between a Power BI Report and a Dashboard?

A Report is a multi-page canvas for detailed analysis. Power BI Dashboards are single-page, consolidated views built by pinning visuals from one or more reports.

2. Can I use Power BI Desktop for free?

Yes, Power BI Desktop is a free application for creating reports and data models. Publishing to the online service for sharing may require a licensed account.

3. What are the best data visualization tools within Power BI?

Power BI includes built-in data visualization tools like bar/line charts, maps, and matrices. The best tool depends on your data story and audience.

4. What is the first step to create dashboards in Power BI?

The first step is connecting to a data source. This foundational step in building dashboards in Power BI loads your data for modeling and visualization.

5. Where can I find more advanced Power BI dashboard tutorials?

For advanced design and efficiency techniques, Augmented Tech Labs offers expert guidance beyond this introductory Power BI dashboard tutorial.

Categories
Blog Data Visualization

Top Data Visualization Tools 2025

Are you stuck in the endless trial-and-error loop of finding the right data visualization tool for your business?

With numerous options available on the market, each with numerous promises, it’s easy to feel overwhelmed and frustrated.

One wrong choice can leave you with a tool that is too basic, too complex, or just not the right one for your needs. 

The truth is, it does not have to be that hard. We’ll help simplify your search for the right data visualization tool!

Say goodbye to the relentless back-and-forth and discover the perfect tool with our curated list of the top data visualization tools for 2025.

Let’s get started. 

Top Data Visualization Tools 2025: Table of Contents

  • What are the Best Data Visualization Tools for 2025?
  • What are Data Visualization Tools?
  • Top 7 Data Visualization Tools for 2025
  • Quick Tips to Choose the Best Visualization Tools for 2025
  • The Future of Data

What are Data Visualization Tools?

Data visualization tools are software solutions that help you visualize your raw and messy data in a visual form. By using visualizations such as graphs, maps, dashboards, and other visual aids, you can make your data more organized and easier to understand.

The process of data visualization enables you to interpret your data in a more intuitive and accessible manner.

You might ask, aren’t spreadsheets and notes good enough? Aren’t they doing the job just fine?

So, why do you really need data visualization for business? 

Why Do You Need Data Visualization?

Remember the times when you used drawings and charts in exams to support your answers? Why do you think you did that? Sure, to get some extra marks, but what else?

Visuals, pictures and images always help people understand data more clearly and concisely. Data visualization for businesses serves a similar purpose. 

Spreadsheets and notes may do the same thing, but what else do you see there beyond rows and columns?

  • Can you identify the trends or spot inaccuracies? 
  • Does it give future insights into your data or your business?

In our experience, the answer to both these questions is “No!”

Data visualization lets you do that and more. The best data visualization tools let you:

  • Spot trends
  • Make data-driven decisions 
  • Simplify your complex data
  • Real-time monitoring
  • Increases your business efficiency 
  • Enhances communications and 
  • Takes your business to new heights

However, not all tools are the same. Some are versatile and easy to use, while others have a lighter learning curve.

To find the right tool for your business, shopping around to see which one best suits your needs is always a good idea. 

We’ve hand-picked a few of the top data visualization tools in the market for you.

Ready to shop and find the perfect one for your business? Let’s go through our list!

Top 7 Data Visualization Tools for 2025

Data visualization for business plays a bigger role in business strategies and planning than ever before. The global market for these data reporting tools is projected to reach $19.5 billion by 2031.

Now that we’re in 2025, we don’t want to miss out on the latest and upgraded visualization tools for our projects, and we know you won’t either.

So, let’s have a look at the 7 best data visualization tools for 2025.

Let’s dig in.

1. Power BI

G2 Rating: 4.5/5

Power BI is an interactive and user-friendly platform for data visualization. It is one of the top data reporting tools amongst businesses, especially embedded into the Microsoft Ecosystem.

The tool continues to be amongst the top favorites due to its integration with Excel, SharePoint, and Teams. Moreover, it functions with different datasets, including Teradata, Salesforce, and SQL Server. 

It offers eye-catching visuals and powerful insights, and quickly turns complex data into easy-to-comprehend visualizations.

What are the Features of Power BI?

  • Advanced predictive analytics with Microsoft Copilot
  • Custom visualization templates
  • Robust security for sensitive data

Pros of Power BI:

  • User-friendly and does not need much technical expertise.
  • Smooth integrations
  • Offers customizable dashboards
  • No speed or memory issues
  • Compatible with the Microsoft product range.

Cons of Power BI:

  • Limited to the Microsoft Ecosystem
  • Cannot handle many different datasets

Pricing:

  • Basic: Free
  • Pro: $10 per month per user
  • Premium: $20 per month per user
  • Embedded: Variable

How does Power BI Stand Out for 2025? 

Apart from being one of the best data visualization tools, Power BI is also one of the most cost-effective options. It stands out in terms of value and accessibility. Its integration with AI features and predictive analytics gives you the ability to gain deeper insights.  

2. Tableau

G2 Rating: 4.4/5

Tableau is number 2 in our list of top data visualization tools. It is used to build powerful dashboards for efficiency analysis.

Best for business intelligence, data storytelling and creative interactive dashboards, Tableau provides AI-driven functionality for visualizations. 

Tableau’s drag-and-drop features remain intuitive, and its features with AI-powered analytics have been significantly enhanced.

What are the Features of Tableau?

  • AI-driven insights through Natural language queries. 
  • Real-time data analytics with improved speed. 
  • Enhances mobile capabilities. 

Pros of Tableau:

  • Powerful visualizations
  • User-friendly interface
  • Mobile responsiveness
  • High performance 
  • Accessibility to many data sources 
  • Strong user community

Cons of Tableau:

  • Expensive on the pricing side
  • Lacks auto-refresh and report scheduling options

Pricing:

  • Basic: Free version
  • Advanced Functionalities: Available for $75 per user per month

How does Tableau Stand Out for 2025? 

It focuses on self-service analytics, empowering users with minimal technical expertise to create professional-grade visualizations. It also seamlessly integrates with cloud platforms like AWS and Azure.

3. Looker Studio

G2 Rating: 4.4/5

Looker Studio, now a part of Google Cloud, is another data visualization tool that offers advanced analytics and data exploration capabilities. 

Formerly known as Google Data Studio, Looker offers real-time analytics to help you track metrics like web traffic and performance. 

What are the Features of Looker Studio? 

  • Direct integration with Google Ads, Analytics, and BigQuery
  • Automated dashboard with real-time data 
  • Enhanced sharing and collaboration

 Pros of Looker Studio:

  • Seamless integration with Google Tools
  • User-friendly interface  
  • Strong collaboration options
  • Real-time analytics for digital marketing

 Cons of Looker Studio:

  • Limited customizations for non-Google datasets
  • Technical expertise is required for advanced features

 Pricing: 

  • Pay-as-you-go pricing model
  • They offer a pricing calculator tool to help you estimate costs based on your specific needs. 

How does Looker Studio Stand Out for 2025?

Looker Studio stands out due to its expandable features. With easy integration and actionable insights, it can be a promising option for the marketing and e-commerce industries. 

4. Qlik Sense

G2 Rating: 4.4/5

QlikSense is a self-service data visualization tool that features an AI-powered data analysis engine. Its AI-powered insights and predictive analytics let you mirror how the human mind processes information.

It offers a no-code environment for ML models and advanced analytics, making it easily accessible to users of all levels.

What are the Features of QlikSense? 

  • AI-powered, intuitive data recommendations
  • Real-time, interactive storytelling
  • Advanced multi-cloud development 
  • Robust security options

Pros of QlikSense:

  • Uses AI and machine learning for data analytics 
  • Automatic chart updates based on data content
  • Seamless integration with different data sources

Cons of QlikSense:

  • Steeper learning curve
  • It can be expensive for small enterprises

Pricing:

  • Free trial before upgrading 
  • Basic: $825 per month, with a starting price of 25 GB and 20 full users, billed annually. 
  • Premium: $2500 per month, with a starting price of 50 GM and 20 full users, billed annually. 

How does QlikSense Stand Out for 2025? 

It seamlessly connects unrelated datasets, and its advanced security measures make it a top choice for many. It differentiates itself with its unique associative data model, and the 2025 version pushes the envelope further. 

5. Cognos

G2 Rating: 4/5 

Cognos Analytics from IBM is another business intelligence platform. It is designed to completely support the analytics cycle, from data discovery to operationalizing insights. 

It caters to a variety of users and helps you transition quickly from simple to complex and advanced analytics.

What are the Features of Cognos? 

  • AI-powered insights with data discovery, predictive analytics and pattern recognition.
  • Customizable visualizations and dashboards.
  • Integrates seamlessly with a variety of data sources, including SQL Server, Oracle and cloud-based platforms. 
  • Offers multi-data source reporting and ETL functionalities. 

 Pros of Cognos:

  • AI-powered analysis
  • Clear and detailed reporting with customizable dashboards 
  • Wide data source compatibility 
  • Predictive and pattern recognition

 Cons of Cognos:

  • It may take some time for new users to adapt. 
  • Small teams might need technical support due to advanced and extensive features.

 Pricing: 

  • They offer flexible pricing options for individual users and enterprises.
  • Standard Cloud On-Demand Price: $10.60 per month per user. 
  • Premium Cloud On-Demand Price: $42.40 per month per user. 

How does Cognos Stand Out for 2025? 

It stands out for its AI-driven and comprehensive capabilities. It is ideal for enterprises with complex, high-volume data and offers security features, such as role-based access and single sign-on.

6. Infogram

G2 Rating: 4.7/5

Infogram is another easy-to-use but prominent web-based data visualization tool. It is focused on creating visually appealing designs, interactive infographics, reports, and charts with AI.

It caters to all users and offers an extensive library of millions of icons, GIFs and photos.

What are the Features of Infogram? 

  • Drag-and-drop interface for easy design 
  • Wide range of customizable templates, maps and charts
  • Real-time data embedding and integrations

Pros of Infogram:

  • User-friendly 
  • Visually appealing content 
  • Customizable elements: Colors, styles etc. 
  • Facilities shareable content creation with built-in metrics for tracking engagement

Cons of Infogram:

  • Limited functionalities in the free version 
  • Less advanced compared to some competitors
  • Users may struggle with integrating custom fonts and datasets

Pricing:

  • Basic: Free
  • Pro: $19 per month, billed annually 
  • Business: $67 per month, billed annually
  • Team: $149 per month, billed annually
  • Enterprise: Contact their team for more information.

They also offer discount prices during specific festival sales. 

How does Infogram Stand Out in 2025? 

The data remains fresh by constantly updating its visualizations, which helps with real-time insights and quick decision-making. 

7. Domo

G2 Rating: 4.3/5


Domo is a cloud-based interactive data visualization tool that allows you to create real-time interactive visualizations in the form of more than 150 charts.

It’s a data visualization and business intelligence tool designed to connect, visualize, and analyze data from multiple sources. Major organizations, such as Cisco and Emerson, use Domo.

What are the Features of Domo? 

  • Real-time data connectivity and integration
  • Interactive dashboard 
  • Drag-and-drop functionality
  • AI-driven insights 
  • Automated alerts

Pros of Domo:

  • A wide array of reports and chart templates
  • Can analyze data from over 1,000 sources
  • Strong mobile capabilities for on-the-go access
  • Real-time collaboration and decision-making

Cons of Domo:

  • Pricing can be a bit expensive for smaller businesses
  • Steeper learning curve for advanced features

Pricing:

Domo offers a free 30-day trial. Pricing options are tailored to every organization’s unique needs. Contact their support team for the best pricing options. 

How Domo Stands Out for 2025? 

Its real-time data and user-friendly dashboards help you make informed decisions in a timely manner. 

Quick Tips to Choose the Best Visualization Tool for 2025

Overwhelmed by choices? Which of the 7 is the best interactive data visualization tool for you? How do you choose the one that best fits your business needs? 


What do you need? A tool with a user-friendly interface or customizable options? To find a tool, start by asking yourself a few questions. Some of these questions could include:

  • What are your visualization goals? 
  • What is the complexity of your data? 
  • Do you have large datasets? 
  • Do you need a tool that integrates with your existing CRM or ERP software?
  • What is your budget? 
  • What features do you need? 
  • Do you need tools that support cross-functional platforms or AI-driven insights?
  • Do you need a tool that scales with your business?

Answering these questions can help you narrow down your options for data reporting tools. Once that is done, you can gain a clearer picture of which data visualization tools align with your budget, needs, and 2025 business goals. 

The Future of Data

Interactive data visualization tools are changing the future of data. These tools are not just making data look prettier, but also changing how we understand and share it.

Moreover, with AI and machine learning transforming the technological landscape, it’s exciting to imagine what will come next.

If you’re still not sure which data visualization tool you should choose, we at Augmented Systems can help!

Our team of experts is always up to the minute with the latest technologies and ready to assist you in choosing the best data visualization for your needs!

Connect with us to find out which data visualization tool is ideal for your enterprise operations!

Top Data Visualization Tools 2025 FAQs:

1. What is the future of data visualization?

The future of data visualization is very promising with new technologies and trends, including:

  • AI-Driven Insights
  • Real-time Visualization
  • AR( Augmented Reality) and VR (Virtual Reality)
  • Improved Data Storytelling
  • User-Centric Designs

2. How to read a bar chart?

To read a bar chart: 

  1. Check the Axes: The x-axis shows categories or periods, while the y-axis indicates values.
  2. Compare Bar Heights/Lengths: Taller or longer bars represent larger values.
  3. Look for Patterns: Identify trends, differences, or clusters across the bars.
  4. Read Labels: Ensure you understand the units and categories being compared.

Bar charts make comparing data across different groups or time intervals easy.

3. Which data visualization method works best to show trends over time?

A line chart is the most effective way to show trends over time. It clearly displays data points connected along a continuous timeline, making identifying patterns, peaks, and declines easy. 

4. What are the two main uses for data visualization?

The two main uses for data visualization are: 

  • Simplifying complex data sets into simple and easy-to-understand visuals.
  • Help make data-driven decisions.

5. Is SQL a visualization tool?


Structured Query Language (SQL) is a widely used programming language for interacting with relational data in areas like business analytics. Professionals commonly use SQL for tasks such as data manipulation, analysis, and visualization.

Categories
Blog Data Visualization

Top 9 Features of Power BI You Need to Know in 2025

Many companies, including 97% of Fortune 500, rely on Power BI for data-driven decision-making.

However, with so many features available, identifying the most useful feature can be challenging.

As a data visualization consultant, I understand how overwhelming it can be to choose the right features. Trust me, even I spent a lot of time trying out different features before I got the hang of it!

Staying informed about these features can help you maximize Power BI’s potential in your work. That’s why, to make things easier, I’ve put together a list of the top 9 features of Power BI you should know to make the most of it. 

But before we dive in, let’s first understand what Power BI is. 

Features of Power BI: Table of Contents

  • What are the Top 9 Features of Power BI for 2025?
  • What is Power BI?
  • What are Power BI’s 9 Best Features For Better Business Decisions?
  • Turn Your Data into Decision With Power BI + Augmented
  • Features of Power BI: FAQs

What is Power BI?

Microsoft Power BI is a powerful business intelligence tool to help you simplify data analytics and reporting. It lets you and your teams collaborate, visualize insights, and make data-driven decisions in real-time.

Power BI seamlessly integrates with hundreds of data sources, including:  

  • Excel spreadsheets,
  • On-premise SQL servers
  • Cloud-based databases 
  • And more!

With Power BI, you can transform complex datasets into clear, easy-to-understand visuals and reports. 

The best part? You don’t need any advanced technical skills. Its user-friendly interface allows you to create compelling visualizations that make data easier to understand.

However, without following best practices or consulting the right data visualization consultants, you may run into common challenges that can affect data accuracy and insights. 

That’s why understanding Power BI’s key features is important. 


These features help you make the most of its capabilities while helping you avoid common mistakes. 

In the next section, we’ll explore the top Power BI features that can enhance your data analytics experience. 

What are Power BI’s 9 Best Features For Better Business Decisions?

There are many powerful benefits of Power BI that can help you analyze your data more efficiently and make smarter business decisions. 


In this section, I’ll walk you through the top features of Power BI and explain how each one can enhance your data visualization and reporting capabilities


Take a moment to explore these features and see which ones best fit your business needs. 

1. Extract Insights from Large Datasets

Handling large datasets can be challenging, especially if you are using traditional tools like Excel. 

Did you know Excel limits each worksheet to 1,048,576 rows?


While that might seem a lot, it can be restrictive if you need to work with massive amounts of data. 


Power BI eliminates these limits, offering a powerful and efficient way to handle large data sets. 

How Does Power BI Help Extract Insights With Large Datasets? 

  • Handles over 100 million rows using advanced storage technology
  • Optimizes performance with dedicated Cloud support 
  • Power BI’s in-memory storage and DirectQuery feature allow you to analyze vast datasets without long processing times
  • Connects seamlessly with multiple sources, like Excel, SQL and more, for a unified view
  • The interactive feature makes it easy to create dynamic reports and dashboards

So, if you are a business handling extensive data, Power BI is a great choice. It offers a scalable, high-performance solution that helps you extract insights without the constraints of a traditional tool. 

2. Create Custom Visualizations with R and Python

Power BI offers a range of built-in data visualizations, such as bars, charts, line graphs and more.


While these standard options cover most of your reporting needs, sometimes you need something more tailored to your specific analysis.


Custom visualizations with R and Python fulfill those custom needs. You can integrate Power BI with open-source libraries from R and Python and create highly customized visuals that go beyond the default options. 

How Does Custom Visualization with R and Python Help You?

  • You get more control over your visuals
  • Create advanced visuals with tools like ggplot2 (in R) and Matplotlib (in Python)
  • Add predictive models, trend lines, and statical insights directly into your dashboards
  • Easily embed R and Python scripts into Power BI without complex setup
  • Clear, customized visuals help you spot trends and insights faster

With that, Power BI gives you more freedom to explore your data your way so that you can create reports and dashboards that truly make an impact. 


3. Automatic Data Refreshes

If you are still making decisions based on your wild guesses and outdated data, you need to think again. Your data may not be up-to-date. Outdated data may lead to missed opportunities, reporting errors, and inefficiencies. 

With Power BI’s auto-refresh feature, you can trust that your reports and dashboards are always current and updated with the latest information in real-time. (Without manual efforts)

How to Create Your Data Up-to-Date With Automatic Refresh in Power BI?


  • Your data updates automatically, making sure you always work with the latest data
  • Saves time by eliminating the need to refresh reports manually
  • Reduces the risk of making decisions based on old and incorrect data
  • Seamlessly connects to multiple data sources, including Cloud services and databases
  • You can set up refresh intervals that match your business needs, like hourly updates or daily refreshes 

With this feature, you can make sure that your reports are always accurate, up-to-date and ready to support your business decisions without any extra effort!


4. Create Understandable Charts from Complicated Data

Did you ever struggle to make sense of endless spreadsheets packed with thousands of numbers? 

Power BI helps overcome this struggle by turning all your data into clear, easy-to-understand visual insights in just a few minutes


So, even if you are not a data expert, you can understand your data with just a glance without scanning through endless rows. 

How Power BI Helps You Visualize Your Data Effectively?


  • Turns numbers into meaningful visualizations, like bar charts, pie charts, and more
  • Offers a variety of built-in visualization options to present data in the best way possible
  • With interactive dashboards, it lets you click, filter, and explore data in real-time
  • Its dashboards are simple enough for anyone to understand
  • Lets you create custom visuals using R and Python, giving you complete control over how you want to display your data

Having data is one thing, but understanding it correctly is what makes a big difference. Power BI helps you do just that with just a few clicks


5. Reuse Datasets Among Different Reports and Dashboards

One of the most common mistakes in data visualization is working with inconsistent or duplicate datasets across multiple reports. 

Manually updating your numbers in different reports is a challenge


But that’s not the case with Power BI. It allows you to reuse datasets across various reports, ensuring consistency. That means you won’t have to manually update multiple versions of the same data in different reports. 

How Does Power BI Help Maintain Data Consistency?


  • Helps you create a single dataset containing KPIs, like gross profit, sales revenue, and customer retention rate, to use across multiple dashboards 
  • Eliminates redundant data processing to centralize data models and reduce errors 
  • Syncs all the reports into one single and trusted dataset to keep everyone on the same page
  • Reduces processing time and enhances report performance with shared datasets
  • The dataset-sharing feature helps standardize calculations and maintains accuracy across all reports

Maintaining a single source of truth for your data is the key to making informed business decisions. Power BI does just that and lets you focus on insights rather than fixing errors. 


6. Integration with Other Microsoft Products

One of Power BI’s biggest strengths is its ability to seamlessly integrate with Microsoft tools like Teams, PowerPoint, and Word. 


This feature makes it easier for you to collaborate, present insights, and streamline workflows without really having to switch between platforms. 

How Does Power BI’s Integration with Other Microsoft Products Help You?


  • Find and share Power BI reports directly in teams to keep everyone in the loop
  • You can export reports to PowerPoint and embed them into interactive presentations
  • Integrate Word Documents into Power BI to add report explanations and references in one place

Thus, by leveraging the benefits of Power BI’s integrations, you can simplify collaboration, enhance your reporting capabilities and improve your productivity.  

Pro Tip: If you need expert guidance on maximizing these integrations, consider our data visualization consulting services. We’ll help you make the most of your data!

7. Regular Updates

Microsoft’s commitment to continuous improvement is Power BI’s one of the biggest advantages and features. 

It receives frequent updates and ensures that you always have access to the latest features and enhancements. 

How Can You Stay Ahead With Power BI’s Regular Updates Feature?


  • Based on user feedback, Microsoft regularly updates and introduces new features
  • Each new feature improves speed, user experience and overall functionality
  • New and improved visuals help you present insights more clearly
  • Regular updates also include security enhancements, protecting your sensitive business data
  • Updates often include integrating compatibility with other Microsoft tools and third-party applications

If you are looking to stay ahead of the market trends, Power BI is your best bet, with up-to-date features every now and then.


8. Create Beautiful Maps

When you are dealing with location-based data, numbers alone won’t tell you a complete story. 


Power BI’s mapping features make your insights clearer and more actionable. That means you won’t have to scan through rows of data. Instead, you can visualize trends, patterns, and relationships on a map easily. 

How Power BI’s Beautiful Maps Help You With Better Business Decisions?


  • Offers multiple map types, such as Standard Maps, Filled Maps, ArcGIS Maps and more
  • Get interactive features, like zoom in and drill down for deeper geographical insights
  • Perfect for you if you are analyzing sales territories, tracking deliveries or understanding customer locations
  • Integrates with Bing Maps and GIS data sources for accurate location-based insights

Power BI lets you understand the map’s effectiveness so that you can make better and faster decisions.


9. Enhancing Reports with Advanced Power BI Features

Power BI goes beyond basic reporting as it provides advanced features that help you analyze, customize and secure your data more powerfully. 

How Can You Take Your Power BI Reports to the Next Level?


  • Publishing as Apps

– Share reports with different audiences using a single link
– Simplifies report distribution for large teams
– Each user can see a customized version of the data

  • Report Themes

– Maintain a consistent look and feel across all your reports
– Customize reports to match your brand
– Save time by applying pre-set color schemes and layouts

  • Row-Level Security (RLS)

– Control who sees what within your report
– Assign security roles to ensure users access only relevant information
– Enhances data confidentiality and management across different teams and departments.

Using these advanced Power BI features, you can enhance your data presentation, improve the security of your data and streamline report sharing

Turn Your Data into Decision With Power BI + Augmented

What would happen if you could make every business decision in real-time and with accurate insights?

  • Real-time data updates for accurate insights
  • AI-powered analytics to uncover trends instantly
  • Intuitive dashboards for a clear data overview
  • Seamless automation for effortless reporting

The answer is simple: Smarter, faster, and more confident business decisions. 

That’s exactly what you can get with Power BI and Augmented

Features of Power BI: FAQs

1. Which Power BI feature is the most helpful?

Although each feature offers a distinct value proposition, the most compelling reason to choose one is the ability to extract significant insights effectively from huge datasets.

2. What data visualization tool features does Power BI offer?

Power BI excels as a data visualization tool. It allows users to convert their data into interactive visuals, such as graphs and charts, to facilitate understanding and decision-making. 

Some of the salient features of Power BI are:

  • Extract Insights from Large Datasets 
  • Create Custom Visualizations with R and Python
  • Automatic Data Refreshes
  • Create Beautiful Maps
  • Monthly Product Updates

3. How does Power BI ensure data security?

Power BI implements efficient data security features, including row-level security and dynamic data masking, to protect sensitive information. By maintaining governance and confidentiality, administrators can control data access and ensure users only view authorized information.

Categories
Blog Data Visualization

Power BI vs Tableau: Which is the Better Data Visualization Tool

Confused between two business intelligence tools – Power BI and Tableau?

You have come to the perfect blog!

I have used both data visualization software for a lot of different data analysis projects.

The good news is that you’re stuck between two of the best data visualization tools on the market.

Sure, both Power BI and Tableau share considerable overlap in their features. But they also have a lot of major differences.

Not to worry: in this guide, I am going to help you decide which tool is perfect for your use case.

To do this, we will discuss their similarities, differences, and ideal use cases. 


If you are in a hurry, check out the quick table of differences – I have summarised my findings to help you quickly choose the right software. 

Tableau vs Power BI: Table of Contents

  • Quick Table of Comparison: Power BI vs Tableau
  • What is Power BI?
  • What is Tableau?
  • Power BI vs Tableau: What are the Key Differences?
  • Which is the Best Data Visualization Software: Power BI or Tableau?
  • Tableau vs Power BI: FAQs

Quick Table of Comparison: Power BI vs Tableau

Short on time?

I’ve got you covered! Check out this quick table of comparison to find out which tool is right for you:

Feature

Power BI

Tableau

Best For

Beginners, Microsoft shops, budget-conscious teams

Data experts, large enterprises, complex visualization

Cost

$9.99/user/month (Pro)

$70/user/month (Creator)

Visualization

Quick, standard reports

Advanced, highly customizable dashboards

Data Handling

Good for typical business data

Excellent for large, complex datasets

Integration

Excellent with Microsoft products

Wide range (Python, R, Salesforce, Slack)

Programming

DAX, M, R

Python, R, Java, C++ via SDK

What is Power BI?

Power BI is Microsoft’s native business intelligence software.


Naturally, this means it has deep integration with all other Microsoft products:

  • Excel 
  • Azure
  • SQL

So, if your organization already uses Microsoft products, choosing Power BI can be very beneficial.

You will have to spend very little time on data prep and cleaning: it can be as simple as a plug-and-play system for data analysis.

But its deep integration is not its only strength!

Power BI is also known for its:

  • User-friendly interface.
  • Affordability.
  • Extensive data connectors.


So, despite being a relatively new data visualization tool, Power BI is one of the best Tableau competitors on the market!

Power BI Features

  • Comes with a wide range of options you can use to visualize data. 
  • Lets you define and create a wide range of relationships between different rows and columns. 
  • Offers a very good mobile experience: you can create and share reports + dashboards on the go. 
  • Supports real-time data refreshes for live dashboards. 


Also Read: Data Visualization Best Practices in Power BI

Power BI: Pros and Cons

Benefits

Drawbacks

Simple UI that facilitates collaboration + report sharing.

Creating complex relationships between data can be challenging.

Supports highly detailed interactive dashboards.

The free version offers very limited functionalities.

You can add or connect data from a lot of different sources.

What is Tableau?

Tableau is a data analysis and visualization tool that debuted in 2003. It was then acquired by Salesforce back in 2019.

Since then, it has become a part of the powerful Salesforce stack.

Today, it is one of the most popular business intelligence (BI) tools on the market.

Why? Primarily because you can choose from a very wide range of visualizations:

  • Gantt Charts
  • Heat Maps
  • Scatter Plots
  • Treemaps

But what I really like about Tableau is that it can handle large datasets very easily.

Plus, you can import data from multiple sources and get AI-powered insights whenever you need!

Let us go through some of its standout features.

Tableau Features Comparison

  • Comes with native tools that help you clean, transform, and organize data before analysis.
  • You can easily share and integrate Tableau with tools like Slack and Salesforce.
  • Lets you create visualizations by simply feeding in text queries like, “Analyze last quarter’s sales performance”.
  • It can handle large datasets and complex queries, so you can scale without worrying about hitting a ceiling. 

Tableau: Pros and Cons

Benefits

Drawbacks

Has a powerful mobile application.

Some configurations are very complex: you will need either a highly skilled IT team or expertise to properly use them.

Handles large datasets with ease.

Expensive subscriptions, which make it an enterprise-grade tool. 

The centralized data repository is very convenient for storing and retrieving data.

Tableau vs Power BI: What are the Key Differences?

In this section, I have compared Tableau and Power BI based on five key features:

  • Data Visualization
  • Cost
  • Security 
  • Dashboard Features
  • Programming Language

So, if you are in a hurry, just jump to the feature most relevant to you!

1. Data Visualization

First, let’s compare their primary function: how well can each of these tools visualize data and information?

Data Visualization Feature

Tableau

Power BI

Primary Strength

Advanced, highly interactive, and customized dashboards.

Strong, user-friendly features for quick report creation.

Ease of Use

Steeper learning curve.

Easier for beginners.

Key Advantage

Superior customization and interactivity.

Speed of development & excellent integration with the Microsoft ecosystem (e.g., Excel).

Target User

Users who need deep, granular control over visual design.

Beginners and users who need to create reports quickly.

Key Takeaway

I recommend Tableau if you want to create & define complex relationships between your data using innovative visualization options.

But if what you need is a tool that supports speed over complexity, go for Power BI!

2. Tableau vs Power BI Cost

When it comes to cost, Power BI is the clear winner.

It is a budget-friendly data visualization software: its basic plan costs very little compared to Tableau’s basic plan.

But that’s by design: Power BI is a tool built for small businesses and startups. Tableau, on the other hand, is an enterprise-grade tool.

Feature

Power BI

Tableau

Overall Cost Impression

Budget-friendly

Significantly more expensive

Starting Price


$9.99/user/month

$70/user/month

Cost Comparison

The basic Pro plan is 7 times cheaper than Tableau’s Creator plan.

The Creator plan is 10 times more expensive than Power BI’s basic Pro plan.

Key Takeaway

If cost is your deciding factor, go for Power BI.

However, if you are a data analyst or need an enterprise-grade tool that can handle large datasets, Tableau will be worth paying $70/month!  

3. Security Features

Next, let us compare the two tools based on a non-negotiable, all-important feature: security.

Feature

Power BI

Tableau

Overall Approach

Pre-built, enterprise-grade security. Integrated with Microsoft Azure.

Highly configurable. You can tailor the security settings.

Data Storage

Uses Azure BLOB storage and Azure SQL.

Based on your own infrastructure and needs.

Authentication & Access Control

Uses the Azure Active Directory (AAD).

Provides pre-set user roles (Viewer, Interactor, Editor). You can then add custom roles with tailored abilities.

Data-Level Security

Row-Level Security (RLS).

Row-Level Security (RLS) + you can restrict access based on roles.

Network Security

Employs TLS encryption for data in transit.

Recommends SSL and HTTPS configurations for secure communications.

Key Takeaway

Power BI’s security features are strongly tied to its Azure framework. So, your data will remain secure. But, it offers very little customization, so you can’t customise the settings outside the Azure infrastructure.

On the other hand, Tableau offers flexibility, putting you in-charge of configuring user roles and restrictions. 

4. Dashboard Features

Next, let us compare how the two platforms help us make and share business intelligence dashboards:

Feature

Power BI

Tableau

UI and Usability

Intuitive and user-friendly.

Steeper learning curve.

Interface & Creation

Simple drag-and-drop functionality, perfect for creating dashboards quickly.

Highly customizable, let you create detailed and rich designs.

Core Strength

Speed.  

Complexity. 

Interactivity

Interactive visuals that update in real-time.

Interactive filtering, drill-down, and real-time updates. Lacks data refreshes.

Key Takeaway

If you’re a beginner, start with Power BI. The drag-and-drop dashboard builder will be perfect for you.

However, if you need rich, in-depth visualization capabilities, Tableau is the better option!

5. Programming Language

I’ve included this last point exclusively for technical users and data analysts out there.

Here, I have briefly compared the programming languages that both the tools offer:

Feature

Power BI

Tableau

Primary Languages

DAX (Data Analysis Expressions) for modeling.

M Language for data manipulation.

No primary built-in language, but offers extensive external integrations.

Advanced Analytics

Supports R programming for statistical analysis.

Integrates with R and Python for statistical computing and analysis.

Extensibility & SDK

External integrations are somewhat limited.

Offers SDK for integration with Python, Java, C, and C++.

Overall Flexibility

Powerful within its own environment, but less open.

High flexibility and a wider range of integration options.

Key Takeaway

If you want to use Power BI, you will have to master DAX. So, only use Power BI if you don’t have any other option but to use a tool that integrates very well with Microsoft products.

However, if you need flexibility and don’t want to spend time learning DAX, Tableau is the clear winner. 

Power BI or Tableau? Final Verdict

Through this blog, we have seen that both Power BI and Tableau have their own strengths and weaknesses. Both of them:

  • Cater to different users.
  • Offer different security features.
  • Use different programming languages for advanced analysis.


So, which one should you choose?

My verdict:

If you are a Microsoft user or comfortable with learning a new language for complex analysis, go for Power BI. I also recommend Power BI if you’re a beginner or need a budget-friendly tool.

If you need a tool that helps you visualize complex relationships, go for Tableau. It will give you the flexibility, security, and advanced visualization capabilities.

And if you have a very specific use case for which you need a data analysis and visualization tool, why not get in touch with us at Augmented Tech Labs?

Our experts will understand your requirements and suggest a tool that will help you achieve your immediate goals without compromising your ability to scale your data visualization needs!

Power BI vs Tableau: Frequently Asked Questions

1. Which is superior, Tableau or Power BI?

Tableau is the better option if you need a tool that lets you tell attractive visual stories with your data. However, Power BI is definitely the better choice if you need a platform that integrates well with Microsoft products and is easy to use.

2. Should I study Tableau or Power BI?

I suggest starting with Power BI if you are just starting out with data visualization. It was much easier to use for simple operations when I started out, and it’s still the case today!

3. Is coding necessary for Tableau?

No, coding is not necessary for Tableau. However, if you know a little bit of languages like Java, it will give you more options to create visualizations and analyze data.

Categories
Blog Data Visualization

Data Visualization Services: Good Choice or Not?

Can data visualization services transform your business? Or is it just another tool that promises more than it delivers?

Can charts and graphs really help double your traffic, capture the right audience and increase your ROI? 

If these questions are keeping you awake, you are in the right place. Every tool promises different results, but the risk of disappointment is real. 

Rest assured, we’ll help you make the right call. Dig in to see if business data visualization is really worth the investment or if there is something better left on the shelf. 

What are Data Visualization Services?

Data visualization or data visualization services refers to converting and presenting your raw data into clear and actionable insights with easy-to-understand visuals. These visuals are presented using different visualizations, including graphs, charts, bars, and more.

Think of it as converting raw, complex data and numbers into meaningful information that your team and stockholders can easily and instantly grasp and make sense of.

Imagine presenting a quarterly sales report to a stakeholder. Instead of presenting a long list of numbers or a spreadsheet with messed-up rows, you use a graph to highlight the KPIs (Key performance indicators).

The result?

  • The stakeholders are no longer lost in scrambled numbers. 
  • The visualizations are quick and instant. 
  • They can interpret what’s working and what needs improvement. 
  • They can make better decisions and identify future trends. 

Business data visualization is a powerful tool to make your numbers more digestible. It helps you get your point across quickly and efficiently. Whether it’s your team, stakeholders, or your clients, data visualization helps them understand the story behind your numbers. 

However, the big question still remains: Will Data visualization really help make smarter business decisions and create more effective strategies?

Keep reading to see how data visualization for decision-making can change the way your business interprets and leverages its data. 

Why Should You Consider Business Data Visualization?

Do you know that images predominate the text? According to the International Forum of Visual Practitioners, the human brain loves pictures as it is naturally wired to absorb, process and communicate information through visuals.

In fact, 90% of the information transmitted to our brain is visual. Images are also processed 60,000 times faster than text and quicker than you can blink. For the same reasons, you should pay attention to the benefits of data visualization.

Think about it! When you look at a pie chart, doesn’t it feel like you are grasping the data way better than a mountain of numbers on a spreadsheet?

Whether you are tracking customer behavior, analyzing your sales report or predicting market trends, you are swimming in numbers. All of this data needs a translator to uncover the “Why” and “How” behind those numbers.

To know what exactly data visualization for decision-making brings to your table, let’s dig into its benefits.  

Top 5 Benefits of Data Visualization

Data without visualization is like trying to solve a jigsaw puzzle without the picture in its box. You have the pieces (data), but it’s hard to see what they create or how they fit together.

Data visualization gives you a big-picture view. You connect the dots, see patterns and understand the story of your data. What are the other benefits of data visualization for decision-making? Let’s have a look.

1. Simplified Data Implementation

Data visualization makes your data easier to understand. It simplifies your messy and complicated data into patterns, trends and anomalies.

Data that would take hours to decipher with a spreadsheet or a table can be processed and understood faster with a well-designed graph or chart.

How can it benefit you?

  • Integrate all your data from different sources into a single cohesive visual. 
  • Get real-time updates and reduce the need for manual data handling. 
  • Reduces the risk of misinterpretation or human error. 
  • Easy to navigate and faster to understand for new members. 

From easily tracking growth to identifying the drops, data visualization helps you lead with clarity and offers efficient decision-making power.

2. Better Communications

You don’t want your end users, such as your team, clients, and investors, to be bombarded with dry numbers, right?

Data visualization is a great tool for communications. It acts like a universal language and makes it easier to share information with your end users regardless of their level of expertise or familiarity with the data.

The visuals add a cherry on top and ensure that even complex information is accessible and understandable for all.

How can it benefit you?

  • Presents data in consistent visuals, ensuring everyone is on the same page.
  • Share live interactive visuals with teams working remotely or in different time zones.
  • You can improve your stakeholder engagement by presenting data-driven insights.
  • Showcase a clear, engaging and easy-to-understand story.
  • Foster collaborative discussions using interactive dashboards.
  • Data becomes accessible to everyone regardless of their technical skills.

With data visualization, you can make your team or a boardroom full of executives grasp the key takeaways and collaborate with a well-designed visualization. Furthermore, you can make real-time updates with cloud-based tools, like Google Data Studio or Power BI. 

3. Increased Customer Engagement

Wouldn’t it be easy to understand and respond to each customer personally? Of course, who wouldn’t want that? However, with so much data spread across different touchpoints, it’s hard to identify what they prefer or need. 

Data visualization drills down into your data to explore customer trends and predict their future preferences. Interactive dashboards allow customers to filter based on different parameters and offer a personalized experience. 

How can it benefit you?

  • Use customized and personalized visual dashboards to show real insights. 
  • Offer clear reporting by breaking down numbers into graphs and maps. 
  • Make them feel more controlled by giving them direct access to their business performance. 
  • Strengthen their trust by helping them track and measure their progress.

Using interactive visualizations, you can understand your users’ needs and preferences and make adjustments in real time. When your users can engage with the data, they feel more prioritized, which, in turn, increases your customer engagement. 

4. Enhanced Data Analytics

Imagine reading a massive book in one sitting. Now imagine reading it by breaking it into small chapters or sections. What’s more manageable, and what’s more overwhelming? The latter is manageable and enhances your power to understand.

The same goes for data. When complex data is divided into smaller chunks, it is easier to analyze. Data visualization does the same with graphs and charts. You can thus focus on one piece of data, see trends and make decisions without getting lost.

How can it benefit you? 

  • Identify trends, patterns and shifts over time quickly
  • Break down large data sets into smaller segments for better and more targeted analyses
  • Spot outliners or anomalies that you might have missed in your raw data
  • Improve accuracy for better insights
  • Simplify complex and multi-dimensional data
  • Predict and forecast the future outcomes

With data visualizations, you can make faster decisions, make better strategic plans and have a deeper understanding of your customers. 

5. Improve Decision-Making

Scrolling through pages of survey responses or acting on an issue after it gets bigger is a no-no for any business. Time is money. Good and faster decision-making is also important to grow in the ever-growing business industry.

Data visualization allows you to make faster and better decisions by detecting trends and spotting problems.

How can it benefit you?

  • With up-to-date visual data, make real-time decisions. 
  • Have clearer business insights
  • Access business performance and make adjustments as needed with KPIs.
  • Make data-driven decisions and not decisions based on your gut.
  • Take immediate action on key findings.

Data visualizations help detect declines in customer satisfaction, identify sales opportunities, and understand shifts in market demand before competitors do.

In a race to make better, faster decisions, a picture is indeed worth a thousand spreadsheets. 

If you really want better outcomes, improved business productivity, enhanced customer experience or identified growth opportunities, start leveraging the benefits of data visualization today. 

The Challenges of Data Visualization

We all know what goes into building a strong, well-designed house (the foundation, costs, workforce, intricate details, interiors, and so much more).

Data visualization for decision-making is like building a house. The goal is clear: a reliable and designed visualization that points towards the right decision. However, the path to get there isn’t always simple. One wrong decision can lead to confusion instead of clarity.

In data visualization, the challenges lie in the following:

  • Selecting the right tool
  • Choosing the appropriate visualization method
  • High initial costs
  • Poor designs 
  • Low data quality and inaccurate data 
  • Over-reliance on the visualizations

Ways to Overcome these Challenges:

  • Select the right tool that suits your business needs.
  • Make sure that the visualization type you choose is easy to interpret
  • Be careful with the visuals. Do not overwhelm or mislead your audience.
  • Be prepared for the financial commitment that comes with high-quality customized visualizations.
  • Do not make poor decisions that can lead to confusion. Make clear and accurate designs.
  • Verify your data beforehand and ensure that there is no missing or misleading data. 

Overcoming these challenges is not a hard nut to crack. Data visualization for decision-making just needs the right structure, tools, techniques and approach.

Furthermore, the data visualization future trends, including AI (artificial intelligence), AR (Augmented reality), and Virtual Reality are even more fascinating. 

Are Data Visualization Services the Right Choice?

Yes, data visualization is absolutely the right choice. Data visualization helps you spend time making better business decisions and taking your business to new heights.

But do you know what the real question is: Can you afford not to invest in it? With the ever-growing data, staying ahead means making quick business decisions confidently. Data visualization helps you do that and lets you stay ahead in the game.

However, for smaller businesses with limited budgets, it could be difficult to justify unless you can demonstrate a data-driven need. You can ask yourself questions such as:

  • Do you have large and complex data that needs interpretation?
  • Are there non-technical stakeholders for whom you need data-driven insights for better communications?
  • Do you have the budget to invest in the tools and expertise?
  • Do you want to improve the accuracy of your reports?
  • What is it that you want from your visualizations?

If you answered yes to all the above questions, why wait? Start visualizing your data. You can start by talking to a data visualization consultant at Augmented Systems

How Augmented Can Help?

Our data visualization consultancy team and developers help you craft impactful stories that turn your data into narratives for strategic growth and innovation.

We won’t give you cookie-cutter solutions. Instead, we will understand your needs, collaborate with you and personalize the solutions for your unique needs.

If you are ready to change your business for the better, contact our data visualization experts today.

FAQs:


Q1. What is bad or misleading data visualization?

Bad or misleading data visualization distorts or confuses the viewer, often by using manipulated scales, improper chart types, or incomplete data. 


It can exaggerate or obscure trends, misrepresent proportions, or lack clarity, leading to inaccurate conclusions. 


Effective data visualization should be clear, accurate, and contextually appropriate.


Q2. What is the future of data visualization?

The future of data visualization is in Virtual Reality (VR) and Augmented Reality (AR). These immersive technologies can transform how we experience information.


Imagine using a VR headset to explore your data or overlay insights onto your surroundings with AR, making the experience more interactive and intuitive.


Q3. How is data visualization used in businesses?

Data visualization in business is used to simplify complex data, identify trends, and make informed decisions. It helps businesses analyze performance, track KPIs, improve communication, and uncover insights that drive strategy and growth.


Q4. Why do modern businesses need data visualization?

Data visualization empowers business users to extract insights from vast datasets, identifying patterns and anomalies. Charts, graphs, and dashboards allow users to grasp insights and trends quickly, enabling better decision-making and data literacy.


Q5. What is a data visualization consultant?

A data visualization consultant is a specialist who assists businesses in creating clear visual representations of data. They develop charts, dashboards, and interactive graphics to enable organizations to analyze, interpret, and communicate data insights more effectively.


Categories
Blog Data Visualization

What Are Common Visual Big Data Analysis Techniques​?

Ever seen a sky full of stars? Isn’t it beautiful, awe-fully inspiring, but impossible to make sense of?

Do you feel the same when looking at your big data? It’s insightful and important but complex and confusing.

If you are nodding along, then it does.

Big data can easily become a cluster of constellations with endless data points and zero clarity. But what if you can actually understand and make use of your data sets? 

Get ready to do just that as we bring you the top 10 big data analysis techniques in this blog. 

Why Do You Need Data Visualization Analysis for Big Data?

Do you know the amount of data created, consumed and generated daily? We are breaking down the numbers for you, so take a back seat because they will blow up your mind. 

With data creation predicted to reach 147 zettabytes by the end of 2024 and 180 zettabytes by 2025, daily data created is breaking down its records, surpassing human imagination. 

Data is generated endlessly every single day, and its sources are diverse, including:

  • Images 
  • Videos
  • Social Media
  • Google Searches 
  • The Internet
  • YouTube
  • File Sharing 
  • E-mails 
  • Maps 
  • Forecasts 
  • Stocks (and many more)

Every move or action you make today is equal to data creation. When analyzing this vast data, many people do not see the forest for the trees. Why? The truth is there is too much raw information, and focusing on the details in between this vastness is very difficult.

This is when data visualization specialists use big data analysis methods, trends, techniques and tools to give meaning to your data.

Big data’s sheer volume, variety and velocity require data visualization best practices to understand and make sense of this ever-multiplying data. Ready to make your data understandable and acted upon? Let’s see how these big data analysis methods can help.

Top 3 Visual Data Analysis Techniques in Big Data

When choosing a data analysis or big data visualization tool, it is important to understand that just picking any chart or graph won’t work. All big data visualization tools are different, so before you start making a decision, ask yourself a few simple questions, such as:

  • What relationship between your data sets are you trying to explore? 
  • Do you want to analyze a single value over time or multiple values? 
  • What are you looking for? Outliners or analysis trends?

Similar questions and the key components of data visualization will guide you in finding the right big data visualization tools. To help you in your decision making, here are some of the most common big data analysis techniques.

1. Regression Analysis

Regression analysis is a statistical method for finding a relationship between a dependent variable and one or more independent variables.

Using this big data analysis method, you can determine how changes in one variable are related to changes in other variables. It’s like trying to figure out how one thing affects another.

For example,

How are marketing and sales influencing your business revenue? Or what’s the relationship between customer acquisition and marketing budget?

Regression analysis lets you see patterns, trends and hidden connections between different data points. You can predict outcomes and estimate what the upcoming results might be. 

How and Why to Use Regression Analysis?

With mountains of data, it can sometimes be confusing to distinguish what matters most from noise. Regression analysis helps you find the important parts of your data by making it easier to understand. Your decisions with regressing analysis will be based on evidence, not guesses.

  • You can start by deciding what you wish to analyze
  • Ask yourself questions
  • Gather and clean your data
  • Choose the type of relationship you want to showcase
  • Use the right tool to perform your regression
  • Analyze the output and
  • Find your answers

Benefits:

  • Simplifies complex data 
  • Helps make predictions
  • Provides quantitative backing 
  • It’s flexible across industries

Limitations:

  • Relies on assumptions
  • Overfitting for complex models 
  • Sensitive to outliners (It can distort your results)
  • Multicollinearity can skew the analysis

Big Data Visualization Tools You Can Use:

  • Heatmaps 
  • Scatter Plots 
  • Regression Line Plots
  • Line Charts 
  • Interactive dashboards

You can use Power BI, Excel, Tableau, and D3.js for regression analysis of your data. From analyzing business performance to predicting customer behavior, regression analysis helps you bring clarity to your data. It helps you see what’s happening and where to go next. 

2. Time Series Analysis

Another statistical big data analysis technique is time series analysis. This technique analyzes data points collected or recorded over a period of time, allowing you to understand how things change over time.

You can spot patterns, identify trends, seasonality and even forecast future outcomes, helping you track changes and predict the future.

For example,

You can track your business sales over regular intervals, identify the pattern and see if they grow every year or month.

It can also help you check if your website’s traffic has a peak on weekends or predict your next month’s traffic. 

How and Why to Use Time Series Analysis?

Time series analysis is one of the best visualization tools for preparing for what might happen next. It allows you to assess seasonal patterns, quarterly patterns and other cycles over a set period of time. 

To use a time series analysis method start with gathering your data. 

  • Collect the data that changes over time
  • Visualize it on a timeline
  • Identify the trend, repeating patterns and the noise 
  • Choose a model to make predictions
  • Analyze and forecast predictions 

Benefits:

  • Identify long-term trends 
  • Better decision-making 
  • Highlights lows and highs 
  • Easy to understand time-based data

Limitations: 

  • Results can be misleading with inaccurate or missing data
  • Cannot handle sudden changes 
  • Random fluctuations do not provide meaningful insights 
  • Difficult to process highly complex data

Big Data Visualization Tools You Can Use:

  • Line Plot
  • Histogram
  • Seasonal Decomposition Plot
  • Area Chart
  • Time Series Plot 
  • Rolling Average Plot 

QlikView, Google Data Studio, MATLAB, Tableau, and Python are some of the tools commonly used for time series analysis. 

Time series analysis is a great tool for time-based forecasting, including weather forecasting and preparing for season demands. For best results, you only have to provide clean and consistent data. 

3. Cluster Analysis

Another visual data analysis technique in big data is cluster analysis. It is a method of organizing your data into groups with similarities. Using these clusters, you can identify similar data points in one cluster.

Thus, instead of making rough guesses on how to organize your data, cluster analysis brings out patterns naturally so you don’t have to (particularly with predefined categories). It’s similar to organizing your closet by color or type of cloth.

For example,

You can cluster data points together for customers who buy product A and a different cluster of customers who buy product B. Each cluster or bubble represents a data point. The size and color of the bubble can represent different attributes of that particular cluster. 

How and Why to Use Cluster Analysis?

The most common types of clutter analysis are dendrograms (tree-like diagrams showing hierarchical data), bubble graphs and multi-dimensional scaling plots. 

You can use these techniques when you want to group, classify or work on customer segmentation, market analysis or high-dimensional data. 

To use a cluster analysis method, start by asking yourself what outcome you want. Do you want to identify patterns in your data or segment different types of customers? 

  • Start with a goal 
  • Clean your data 
  • Standardize it based on variables or scale 
  • Choose a cluttering method
  • Use tools to run the analysis 
  • Plot the clutter to visualize it

Benefits: 

  • Helps find hidden patterns
  • Helps target strategies better
  • Simplifies complexity 
  • Versatile for all industries

Limitation:

  • Sensitive to the quality of your data
  • Different algorithms produce different clusters for the same data 
  • Understanding and labeling the clusters can sometimes be complex 
  • Sometimes difficult to find out how many clusters you need

Big Data Visualization Tools You Can Use:

  • Bubble Chart
  • Dendrograms
  • 3D Scatter Plots
  • Elbow Curve
  • Spider Plot 
  • Heatmaps
  • Box Plot

Cluster analysis will help you organize your chaotic data and make intuitive decisions. You can use tools like Tableau, Power BI, QlikView and Google Data Studio.

See Data Like Never Before 

The ocean of data available is not stopping any time soon. Does that mean you cannot grasp the individual drops from it? No. Visual data analysis techniques in big data empower you to comprehend the finer details of your data within the bigger picture.

It may not be as simple as dressing up your graph to make it look better, but it is a powerful tool for big data.

Don’t want to let your data go to waste? Consult our team of data visualization specialists. We will transform your data the same way we’ve transformed countless others.

FAQs:


1. What is visualization data analysis?


Data visualization is a technique for converting raw information or data into a visual format, such as a map or graph. It is done to make data easier for us to understand, interpret and make data-driven decisions. 


2. What are the types of big data visualization categories?


Various forms of data visualization exist, including but not limited to bar charts, line charts, scatter plots, pie charts, and heat maps. These represent commonly used methods for presenting and interpreting data.


3. What are the benefits of analyzing big data?


The benefits of analyzing bid data are many, including:

  • Improved decision-making
  • Increased agility and innovation
  • Better customer experiences
  • Continuous intelligence
  • More efficient operations
  • Improved risk management


4. What is big data analysis?

Big data analytics refers to the methods, tools, and applications used to collect, process, and derive insights from varied, high-volume, high-velocity data sets. These data sets may come from various sources, such as web, mobile, email, social media, and networked smart devices.


5. Why is big data used?


Big data allows you to collect and process real-time data points and analyze them to adapt quickly and gain a competitive advantage. These insights can guide and accelerate the planning, production, and launch of new products, features, and updates.

Categories
Blog Data Visualization

Data Visualization in Finance: Ultimate Guide

Does your spreadsheet look like the Great Wall of China—filled with numbers, endless rows of revenue figures, profit margins and stock fluctuations? 

If you’re reading this right now, it probably does.

Shifting through rows and columns of data could leave you clueless with a room full of errors. 

But what if there was a way to give meaning to your data – More clarity, better understanding and actional insights?

This is where a data visualization consultant steps in. With their expertise, you can transform complex financial data into clear and compelling visuals that drive informed decisions.

Data visualization in finance can turn the tables and do just that. How?

Let’s break it down together in this blog. 

What is Data Visualization in Finance?

Data visualization in finance is the process of visualizing massive sets of unprocessed data into graphical representations. Visually appealing and easy-to-understand visualizations help you make better financial decisions.

These visualizations represent financial data, reports and statements to provide insights into different financial metrics. These metrics include:

  • Sales figures
  • Profit and loss
  • Equity
  • Assets and liabilities
  • Income and expenses and other financial data.

But you must be wondering, isn’t this what spreadsheets and other financial tools already do for you? Well, not everyone on your team has the data science skills to interpret all of the ever-growing data or the time to spend hours understanding it. Isn’t it?

That’s when the role of data visualization enters into the picture.

What is the Importance of Data Visualization in Finance?

In traditional methods, humans crunch numbers, and decision-making is based on assumptions drawn from calculating risks and trends. However, with global data expected to skyrocket to 180 zettabytes by 2025, these methods are becoming absolute.

Finance teams are under pressure, and the sheer volume of data highlights the necessity for advanced tools and strategies.

Here’s when data visualization bridges the gap in transforming, processing and analyzing Big Data. Moreover, businesses that prioritize visual analytics are 28% more likely to find timely insights. 

 What more can you do by visualizing financial data? You can: 

  • Take advantage of trends
  • Improve performance
  • Enhance service offerings
  • Set realistic goals
  • Make more informed decisions
  • Improve communications with stakeholders
  • Tell more compelling and clear stories 
  • Forecast revenue (Apart from many more things)

You would be wrong to think data visualization is all about collecting data, processing it and presenting it. It isn’t all that valuable until your stakeholders or end-users can draw meaningful conclusions.

Therefore, different charts and graphs are used to make the visualizations simple and easy to understand. 

What are the Common Types of Financial Data Visualizations?

An often-used statement on the internet states, “People process visuals 60,000 times faster than words.” Therefore, charts, graphs, pictures, diagrams and plots are used to understand the data relevantly.

There are several types of data visualizations, and we would like to re-familiarize you with a few common ones.

  • Bar Charts 

In the finance sector, you can use a bar chart to compare data across different categories. You can also visually present prices over a given period of time. The vertical axis of the bars represents the highest and lowest data range for any specific asset.

Complex and big financial data is easy to interpret for visualizing trends, comparisons, and distributions. Using these charts, you can track expenses, perform a revenue analysis, visualize returns for assets and do a risk analysis.

  • Line Graphs 

A line graph, a line plot or a line chart is another visualization graph that uses lines to connect individual data points. You can represent a specific value at a particular time interval at each point of the line graph. It also visualizes trends and changes over time.

The graph depicts an asset or security’s historical price action. It is also ideal for tracking continuous data, identifying peaks or dips, and observing patterns in financial metrics.

By monitoring stock price fluctuations and revenue growth over time, analyzing trends and understanding liquidity patterns, you can forecast your business’s future performance.  

  • Scatter Plots 

Commonly used in statistical analysis to visualize numerical relationships, scatter plots, scatter charts or XY graphs, represent numerical data points. The data points have one variable on each axis with data plotted as points on the graph.

A regression line runs through the dots that represent the relationship between the variables. Widely used in finance, these graphs allow you to identify correlations, trends and outlines to make data-driven decisions.

Moreover, you can also use scatter plots to analyze risk vs. return, perform loan analysis or analyze changes in expenses impacting your revenue. 

  • Heat Maps

A heatmap is a two-dimensional data visualization graph that uses colors to represent data and values. The map is typically a grid of colors, with each cell colored differently based on the values.

They are often used in financial analysis to represent data such as stock prices, trading volumes and market trends.

From risk management to revenue performance, heatmaps can help you identify areas of concern, opportunities and patterns that may not be obvious, enabling you with faster insights.

Each visualization fulfills a specific purpose but shares a common goal of extracting meaningful information from your scattered data and numbers.

The key factors of data visualization are helping the end user understand their data, uncover trends and tell a data-driven story. Visualization will help you analyze your data perfectly and help avoid confusion.

Leveraging correct financial data visualization tools, you can easily turn your messy, raw data into user-friendly and easy-to-read visualizations.

The next question is how to correctly and perfectly visualize your data. To help overcome this challenge, we have a few tips. So keep reading. 

6 Best Practices for Financial Data Visualization

Visualizing financial data is similar to navigating through a new city without a map. You might reach your destination, but there are so many changes. You can either get lost a few times or take a much longer time to reach it.

Therefore, even though your charts and graphs look pretty, they won’t be of any use if you don’t follow the best practices for visualizing them. We have a few tips for you to help you give your visualizations an edge. These include: 

1. Keep it Simple and Clear

The key to an impactful data visualization in finance is to keep it simple and clear. Your user should be able to easily understand and interpret the data presented.

Lack of clarity and simplicity may lead to confusion and misunderstandings. A clear, concise and straightforward data visualization is intuitive and effective.

Tips for Simple and Clear Visualization

  • Don’t overload the data, focus on only the essential data
  • Avoid using distracting elements
  • Use a logical and consistent color scheme
  • Add clear labels, such as axes and titles
  • Ask for advice to ensure clarity and relevance

Simple data visualization will enable your end-user to grasp the information quickly, leading to effective decision-making and a better understanding of your financial data. 

2. Make it Interactive

Interactive features engage your audience more with your data and offer better insights. Your users will rapidly explore the information, recognize patterns and evaluate the data better.

Tips to Make Your Visualization Interactive

  • Use features such as tooltips, filters and zoom functionalities
  • Add design elements to your graphs and charts 
  • Create interactive dashboards
  • Integrate your visualizations for real-time tracking 
  • Provide side-by-side comparison visualizations

Interactive data visualization in finance will help your audience to:

  • Analyze the data 
  • Recognize trends
  • Explore and compare scenarios
  • Manipulating the data for a better understanding
  • Engage with the visuals

Interactive visualizations are crucial, especially for real-time financial data visualizations. 

3. Understand Your Audience

Before you finalize the type of visualizations for your project, ensure that you first understand who your audience is. Are they your employees, executives, stakeholders, or managers?

Do they need a clear trend line, high-level insights or bar charts breaking the monthly expenses?

It is crucial to understand your audience and tailor your visualizations to their knowledge level and needs.

Tips to Understand Your Audience

  • Find out who your audience is. Are they financial experts or stakeholders?
  • Understand their goals and what they desire from the visualization
  • Consider their time 
  • Ask for feedback from your colleagues 
  • Know your audience’s pain point
  • Use the language they prefer

Understanding your audience will ensure clarity, prevent confusion and help them make better decisions.

4. Tell a Story with Your Data

It is important to weave a compelling story around your financial data. Visualizations are not about pretty pictures. Each visualization should guide your end-user through key insights.

Every chart or graph you create should have a clear purpose. You can start by asking yourself, “What is the key takeaway of your project?”

Tips for a Compelling Story

  • Create a narration, and give a start, middle and end to your data story
  • Show how the data evolves and why it matters.
  • Make the complex data, digestible by breaking them down
  • Offer clear recommendations 
  • Bring context into your data 
  • Explain why the data matters in the real world

Moreover, to make the story compelling, you can use titles, headings, and captions and guide your audience using a story for your data. For example, you can highlight the monthly or quarterly profits and growth trends and pinpoint the spikes and lows. 

5. Ensure Accuracy and Consistency

Accuracy and consistency mean validating your financial data and visualizations. This does not mean that you show or present all your financial details, but the visuals should not mislead the audience.

Tips to Bring Accuracy and Consistency

  • Double-check the numbers
  • Do not compromise on details and data sources
  • Keep your data updated 
  • Be consistent with fonts, colors, scale and labels 
  • Cross-check for errors 
  • Clearly define assumptions and limitations

Accuracy is crucial to ensure credibility and trustworthiness, as small errors can lead to big disasters and discrepancies.

Additionally, consistent use of colors, fonts, tone and other visualization elements makes your visualizations less distracting and ensures credibility. 

6. Use the Right Visualization Tools

Selecting the right charts and graphs matters, but what is equally important is choosing the right financial data visualization tools.

There are several tools available in the market for financial data visualization. Tools such as:

  • Tableau 
  • Power BI 
  • Infographics and more

Also, make sure that you choose the right visualization for the right project. Use bar charts for comparisons, line graphs to show trends over time, pie charts for illustrating proportions and heat maps to reveal trends.

Tips to Choose the Right Visualization Tools

  • Understand and assess the complexity of your data 
  • Research for a tool that is compatible with your existing system
  • Look for a tool that is user-friendly and customizable
  • The tool should be flexible and scalable 
  • Consider the cost of the tool and its value for money 
  • Try different tools before you finalize one

The right visualization tool will help you avoid clutter, and each element or visual will help you serve a specific purpose for your visualizations.

The importance of data visualization cannot be overstated in the field of finance. However, it needs to be well presented. When done poorly, the visualizations will only confuse your audience, resulting in misinterpreting the data and making them feel more frustrated.

To avoid poor visualizations, you can also consider hiring data visualization consultants to help you transform your complex financial data. 

Tips to Avoid Pitfalls in Financial Data Visualization

Ever seen a confusing graph overloaded with numbers? Were you able to interpret anything out of it? Maybe a little. 

Data visualization is a great way to transform your raw data into actionable insights. However, small missteps and poor decisions can lead to potential pitfalls, hindering your progress. Here are a few tips to help you avoid these pitfalls when visualizing financial data.

  1. Do not over-simplify or overdo your visualizations.
  2. The user should have proper knowledge of the tools and their elements. 
  3. Avoid using missing or misleading information.
  4. Remember to follow regulatory guidelines. 
  5. Check with the management for confidential data. 
  6. Integrity and quality of data are paramount. 
  7. Check for human errors before presenting the visualizations. 
  8. Do not overlook important information due to over-reliance on the visualizations.
  9. Poor storytelling might create complete chaos and confusion. 
  10. Give proper context to your numbers. 
  11. Clearly label everything. 
  12. Use proper colors. Use them wisely. 
  13. Ensure your axes remain consistent. Watch out for scales.

By following best practices and keeping these tips in mind, you can ensure to implement a successful visualization for your financial data. Avoiding these pitfalls will make your visualizations insightful. 

Conclusion

Collecting data is easy. Businesses collect all sorts of data every minute. What matters is reading, analyzing and presenting the data. 

Right findings will only take your business to new heights, so utilize data visualization to present data findings in a way that makes sense to everybody and helps your business succeed. 

If you think your financial data feels overwhelming or lacks direction. Contact our data visualization consultants with specialized skills to help you craft visuals just right for your audience.

FAQs


1. What is the role of data visualization in finance?

Data visualization simplifies the task of recognizing patterns and identifying potential issues in your organization’s finances. It enables you to pinpoint which processes or products are successful and profitable, as well as those operating at a loss or requiring optimization.


2. How does data analytics help in risk management?

By leveraging data analysis, you can uncover hidden patterns often missed by traditional risk assessments. This approach allows you to identify risks and proactively mitigate them, ensuring better outcomes and greater stability.


3. What is a data visualization consultant?

Data Visualization Consulting is a specialized field that uses visual representations to convert complex data into intuitive, actionable insights. As businesses gather extensive data, it becomes crucial to interpret and utilize this information effectively.


4. How is financial data analyzed?

One of the most common ways to analyze financial data is to calculate ratios from the data in the financial statements to compare against those of other companies or against the company’s own historical performance.


Financial analysis can be conducted in both corporate finance and investment finance settings. 


5. How to visualize financial statements?

Use a line chart, column chart, or area chart to show how your data changes over time. These charts highlight trends, making acceleration, deceleration, and volatility more visible.

Categories
Blog Data Visualization

Common Data Visualization Mistakes and How Consultants Avoid Them

In the information age, attention spans are decreasing, whereas growth is more important than ever. 

In the era of thrive or die, how can you reach more people and inform them of your products and services?

If you’re still with us, that means this question is of vital importance to you. 

And the answer to your question lies in visualization. 

We believe that visualization holds the power through which you can gain and retain customers even in the age of ever-reducing attention spans.

However, data visualization isn’t without its challenges. Just as vivid visualization vamps viewers, poor picturization promotes peril. 

So, why are some data visuals more attractive than others? What sets a good visualization apart from a poor one? 

Well, visualization is like any other concept—there are ideal ways to use it and mistakes that can blur its message. 

But don’t worry; we won’t let your visuals get lost in the void of visualization errors!

In this blog, we’ll tell you how you could be committing data visualization heresy. We’ll also baptize you with data visualization’s best practices to help you engage with your target audience!

Pitfalls of Poor Visualization – Is Bad Visualization Really That Bad?

The role of data visualization has been to transform the way we tell stories or convey information. Gone are the days when people clung to every word they read while exploring ideas. Scanning is the new reading.

So, before we understand what data visualization mistakes you can make, let’s see why you should avoid them in the first place:

  • “Failed to Deliver Message” 

What does the data visualization process entail? To create an image that says a thousand words without using any. So, it’s not that bad visualization doesn’t paint a picture. Rather, the visual invokes words that aren’t the ones you want it to. 

So, the first peril of bad visualization is its failure to deliver the intended message.

  • Inaccurate Visualization is Broken Communication

It’s not that viewers will just ignore bad visualization. After all, how would they even know that the visualization contains a mistake without at least glancing at it? So, unless you’re using really repulsive colors (which, as we will see, you should avoid at all costs), people will at least give your visual a chance. 

And that’s exactly where the problem lies. If the viewer trusts your visual or is enticed by it, they’ll expect it to convey something useful. 

If it doesn’t, they might not appreciate the message. Worse, they’ll probably not even give your next visual a fair chance. 

To them, you’ll be the boy that cried wolf (or “look here”). Thus, poorly visualized data can be worse than no visualization at all!

  • Visible Waste of Resources

Data visualization consultants say that every instance of visualization has an opportunity cost. The radar chart you drew up to demonstrate your product’s strength to potential customers could instead have been a Venn diagram that did both – conveyed the strengths and convinced them to purchase it. 

Remember, a billboard, the first slide of your presentation, or the lead image of an Instagram story can only accommodate one visual. Thus, every suboptimal visual is an opportunity lost. And we’re not even accounting for the time and the resources wasted in making the visuals themselves.

Now that you see why you should take a closer look at the visuals you create and use, let’s consider what mistakes could make them less effective.

Common Data Visualization Mistakes (And How To Avoid Them)

Not all of us are data visualization specialists. So, data visualization mistakes can be hard to see. After all, you just converted complex calculations into accessible images! What could’ve gone wrong?

Well, let’s look at a list of common errors to watch out for when before and during the process of data visualization:

1. Warning: Information Overload Detected!

Why do we visualize? To convey a message without asking the viewers to perform mental gymnastics. Well, bad visualization does both: it puts an image into the viewers’ minds and asks them to interpret its meaning. 

Thus, bad visualization takes the scenic route to failure – the list that should’ve been an image becomes an image that might as well be a list! How should you avoid this?

  • Identify Purpose

Before visualizing the data, visualize the purpose of visualization. Why do you want to show your viewers this data? Do you want to inform, invite or incite? 

Once you know why you’re visualizing, you’ll better understand how you should do it.

  • Use Interaction

Sometimes, backing a visual with a lot of data is unavoidable. For instance, say you’re running a fantasy football and betting app. Your visualization must be supported by detailed analytics so that participants can understand trends and odds. 

How should you avoid overloading information in the visual? 

By allowing users to select what data they want to visualize! They can select the month, the player, the game or the team whose data they want to analyze visually. Interaction allows viewers to be in control, which retains their attention and even increases traffic.

2. Use the Wrong Charts, Get the Wrong Results (Alt: Wrong Charts = Wrong Results)

Another common data visualization mistake is to use the wrong medium. 

For example, let’s say you want to show your team quarterly sales trajectories of the three products you launched last year. Should you choose three different bar graphs or one neat column chart? 

You could go with the first one – but everyone will hate you after sitting through the sales meeting. 

And that’s certainly not the goal of your visualization!

So, you must avoid data visualization’s problem-solution mismatch. Every type of data will have an ideal visual representation. 

But how will you know which visual fits what data? Consider two suggestions:

  • Study Available Variants

After you have identified why you want to visualize your data, explore different media of visualization.

  • If you’re going to demonstrate the user intent of a single product, use a pie chart. 
  • Go for a Venn diagram to identify common user intents of different segments. 
  • If you want to understand the buying journey, visualize it through a Gantt chart.


  • Try Different Charts

Sometimes, instincts can fail you: a chart you through was optimal for a dataset looks skewed now that you’re staring at it. 

In such cases, data visualization consultants suggest you try visualizing the same data through different charts until you spot the ideal visual. 

You don’t get a second chance at first glance, so iterate till you’re satisfied you’ve found the best version!

Criticizing your creations is hard. After all, you understand the work and the story behind your data, so why wouldn’t others? 

Precisely because they’re not you! 

We use visuals because we understand the data and want the viewers to grasp what we see. But still, we’re the ones making the visuals. How should we account for this gap?

Source


  • Visualize for Viewers

First, ask yourself: For whom are you visualizing the data? Fellow employees? Potential customers? Executives? Partners? 

Curate the visualization based on their experience, expertise and enthusiasm. Tailor it to the level of their investment in seeing the visual. Match the intent behind the visualization with the viewer who needs to be convinced.

  • Visualize Where?

Second, consider where people will encounter your data visualization. Is it for a captive audience during a product launch? For a billboard that people could easily miss? Or will people come across it on their Instagram feeds?

  • A Venn diagram could look great on a billboard. 
  • But people could definitely look at a radar chart on their Instagram. 
  • On the other hand, even a captive audience would appreciate a simple pie chart showing them how much discount they’re about to get.

So, visualize how and where people will encounter your visualization before rendering it.

4. Error: Narrative Not Found

Good visualization tells a story. For instance, a Venn diagram can tell viewers why they’re at the center of a product’s appeal. A heat map can advise them to drop a player from their fantasy football team. A density map could convince them to come and live in your new rental unit. 

Similarly, a bad visualization doesn’t tell a story: it merely displays data. 

Poor pictures may have a purpose, but they don’t have the right one. A good visualization always tells a story; if it doesn’t, the users will make one up on their own or forget the visual. Either way, your resources get wasted. To avoid this: 

Source

  • Tell a Story

Before visualizing, narrativize. Ask yourself: what does the data tell you? What would convince the viewers? 

Bridge the gap between the two questions to develop a story that fits the data and will appeal to the viewers. Even if the viewers forget the visual, they’ll remember the story. After all, isn’t that the goal of a visualization?

  • Seek Feedback

Even the best data visualization consultants seek feedback on the visuals they render. We recommend the same. Feedback helps break through creator bias and look at the visual through a different lens. 

At the same time, it allows you to understand the narrative that your visual constructs in the viewers’ minds. If it’s not what you intended, refine, reframe, and rework the visual.

5. Dirty Designing

Data visualization is as much about visualization as it is about data. Without bright colors that bite or a consistent scheme that soothes, your visualization is incomplete! 

And an incomplete visualization will convey an incomplete message! So, colors are critical for clear delivery. Here’s how to avoid displeasing design, the deity of data visualization:

Source

  • Choose Consistent Colors

Sticking with the theme of your visual is as vital as choosing one. This is easier said than done. Answer three questions before picking the colors for your visualizations:

I. What colors soothe and suit the message?

II. Which colors can distract the viewers from the story?

III. Where should color contrast be avoided to minimize noise?

To pick consistent and comforting shades for your visuals, respect the holy trinity of coloring visualizations.

  • Let the Colors Talk 

Sometimes, colors offer more than contrast. They represent more than different variables. They can also show sensitivity. 

For instance, if you’re a health insurance agent, a visual representing the cost of medical care in red and the savings through insurance in green can symbolize blood and money without you even mentioning the words. 

So, don’t just pick contrasting colors; tell a color story.

  • All About the Data

Sometimes, your visuals are doomed before you even render them. Why? Because they’re based on shaky data. After all, how can your visual convince the viewer if its message itself is incorrect? 

For instance, an outrageous visualization that contrasts Republican and Democrat voters can garner a million views.

However, if you fail to contextualize the data with population density, the comments on the visual will drive you to infamy. Thus, clean data is a prerequisite for clear visuals.

Here’s how you should avoid visualization errors due to convoluted data:

  • Clean the Data for Consistency

Sometimes, your sales figures tell a brilliant visual story. But, the scale on which they are compared is inconsistent. While Product P is scaled per thousand units sold, Product Q is measured for every ten thousand units. 

Remember, if your visual narrative is outrageous but based on an error, even one closer look will unravel it. 

Ironically, the visualization that is supposed to aid your storytelling could be the end of your story. So, the moral is to clean the data as much as possible before visualizing it.

  • Digest the Data Before Designing the Visual

“If you torture the data long enough, it will confess to anything,” goes the adage. Remember, confessions under torture are almost always inaccurate: they’re volunteered out of insight but spat up for survival. 

The best visuals aren’t aimed at survival; their goal is to convince. And in the long run, it is better to convince people of genuine insights rather than lead them to quick conclusions. 

To this end, don’t design a visual and then hunt for data that fits. Trust the process: follow the data and show the viewers its genuine conclusion.

Data Visualization Consultants Say…

Visuals used to cost a dime a dozen. With the advent of AI, they cost even less. Or do they? 

As we have seen, bad visualizations cost more than money. Defective data, dirty design, no narrative, biased basis, clunky charts, and invasive information can blur even the most vivid visuals. They can drive users away, fail to deliver the message and waste your resources. 

So, what should you do to ensure you follow data visualization’s best practices? 

We can help! At Augmented Systems, we specialize in helping you eliminate data visualization mistakes by providing you with visualization experts tailored to your company’s needs! 

Look no further for expert visualization assistance: contact us today, and together, let’s create promising visualizations for your audiences!